Mapletree Industrial Trust Share Price 2026: DPU History, 6.9% Yield & Data Centre Deep-Dive (SGX: ME8U)
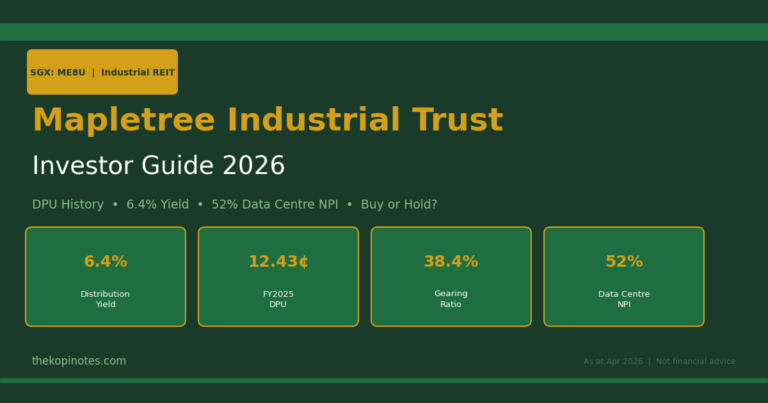
Mapletree Industrial Trust (MIT, SGX: ME8U) is one of Singapore’s most recognised industrial REITs — but in 2026, it’s evolved into something more interesting: a hybrid industrial-data-centre REIT with over 57% of assets under management (AUM) in data centres globally. With a share price around S$1.97 and a trailing dividend yield of approximately 6.9%, MIT sits at the crossroads of S-REIT income investing and the global data centre boom. This deep-dive covers MIT’s DPU history, current yield, portfolio breakdown, gearing, and whether it makes sense for Singapore dividend investors in 2026. This article is for informational purposes only and does not constitute financial advice. Please do your own research before investing.
Table of Contents
Contents — Click to expand
- MIT at a Glance: Key Numbers for 2026
- MIT Share Price History & 2026 Outlook
- DPU History: FY2020 to FY2026
- Current Dividend Yield & How It’s Calculated
- Portfolio Breakdown: Data Centres, Hi-Tech & Industrial
- Financials: Gearing, ICR & 3Q FY2026 Results
- Peer Yield Comparison: MIT vs Industrial S-REIT Peers
- Key Risks to Watch
- Is MIT Worth Buying in 2026?
- FAQ
MIT at a Glance: Key Numbers for 2026
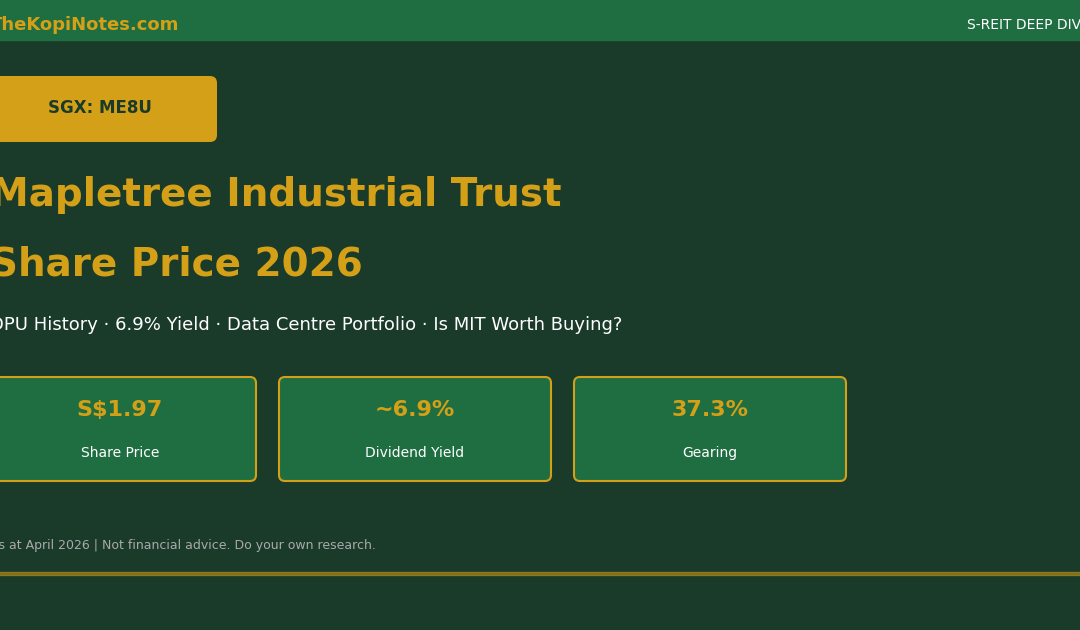
Before diving into the details, here is a quick snapshot of Mapletree Industrial Trust’s key metrics as at April 2026:
| Metric | Value |
|---|---|
| SGX Ticker | ME8U |
| Share Price (Apr 2026) | ~S$1.97 |
| Market Cap | ~S$4.8B |
| Total AUM | ~S$8.5B |
| FY2025 Annual DPU | 13.57 cents |
| 3Q FY2026 DPU (quarterly) | 3.17 cents |
| Trailing Dividend Yield | ~6.9% |
| Aggregate Leverage (Gearing) | 37.3% |
| Interest Coverage Ratio (ICR) | 3.9x |
| Number of Properties | 136 (SG: 79, North America: 55, Japan: 2) |
| Data Centre % of AUM | ~57% (SG + overseas combined) |
Data as at 3Q FY2026 (ended December 2025) and April 2026 market prices. Figures are approximate.
")
MIT Share Price History & 2026 Outlook
Mapletree Industrial Trust’s share price has been under pressure over the past two years, weighed down by elevated interest rates and the divestment of three Singapore industrial properties in August 2025. As at April 2026, ME8U trades at approximately S$1.97, down meaningfully from its 2022 peak above S$2.80.
The Trump tariff shock in early April 2026 added further volatility to all S-REITs, as global risk-off sentiment drove selling across rate-sensitive assets. However, MIT’s unique data centre exposure — which is less directly affected by manufacturing tariffs — means it may be better positioned than pure industrial or logistics REITs.
Key share price catalysts to watch in 2026 include: any Fed rate cut signalling (lower SORA improves DPU), occupancy improvements in North American data centres (currently weighed by non-renewals), and further acquisition news following the Tokyo and Osaka data centre additions in FY2025.
For context on how Singapore’s rate environment affects S-REIT share prices, see our piece on SORA Rate Singapore 2026 & S-REIT DPU Recovery.
 DPU History FY2020–FY2026E")
DPU History: FY2020 to FY2026
MIT pays distributions quarterly, which is one of its investor-friendly features. Here is the annual DPU track record going back to FY2020 (MIT’s financial year runs April–March):
| Financial Year | Annual DPU (cents) | YoY Change |
|---|---|---|
| FY2020 (Mar 2020) | 12.15¢ | — |
| FY2021 (Mar 2021) | 12.16¢ | +0.1% |
| FY2022 (Mar 2022) | 13.32¢ | +9.5% |
| FY2023 (Mar 2023) | 13.57¢ | +1.9% |
| FY2024 (Mar 2024) | 13.43¢ | –1.0% |
| FY2025 (Mar 2025) | 13.57¢ | +1.0% |
| FY2026E (Mar 2026)* | ~13.2¢ (est.) | ~–2.7% |
*FY2026E is estimated based on Q1–Q3 FY2026 results (9.89¢) extrapolated. Excludes any divestment gains. Source: MIT Investor Relations.
The DPU story for MIT is one of stability rather than dramatic growth. From FY2020 to FY2023, distributions grew steadily, supported by acquisitions in data centres. FY2024 saw a slight dip as rising interest costs bit into income. FY2025 recovered to a new DPU high of 13.57¢ — but FY2026 is tracking slightly lower, mainly due to the income vacuum from three Singapore asset divestments in August 2025 and softer North American data centre occupancy.
Importantly, management has maintained distributions without cutting — a key reassurance for income investors. The quarterly cadence (March, June, September, December ex-dates approximately) provides regular cash flow to unitholders.
For dividend investors tracking this alongside other industrial S-REITs, check our Best S-REITs Singapore 2026 Guide for a sector-wide comparison.
Current Dividend Yield & How It’s Calculated
At a share price of approximately S$1.97 (April 2026), MIT’s trailing dividend yield works out to approximately 6.9%, based on the FY2025 full-year DPU of 13.57¢.
The calculation is straightforward: Annual DPU ÷ Share Price × 100 = 13.57¢ ÷ S$1.97 × 100 = ~6.89%.
If FY2026 DPU comes in at the estimated 13.2¢, the forward yield at current prices would be approximately 6.7%. Either way, MIT offers a meaningful yield premium over the 10-year Singapore Government Securities (SGS) bond yield of around 2.9–3.1% as at April 2026 — a spread of roughly 370–400 basis points, which is attractive by historical standards.
Use our S-REIT Yield vs SGS Bond Spread Calculator to compute the current spread for MIT and compare it against your own yield target. You can also estimate total income from your MIT position using the Dividend Portfolio Yield Calculator.
One note: MIT’s distributions are paid quarterly, which means each quarterly distribution per unit is approximately 3.39¢ (based on FY2025 annual DPU of 13.57¢ ÷ 4). The Q3 FY2026 payment was 3.17¢ — slightly below average, reflecting the diluted effect of the asset divestments mid-year.

Portfolio Breakdown: Data Centres, Hi-Tech & Industrial
This is where MIT stands apart from most Singapore industrial REITs. As at 3Q FY2026, MIT’s S$8.5 billion portfolio spans 136 properties across Singapore, North America, and Japan — with the majority of AUM in data centres:
| Asset Type | % of AUM | Geography |
|---|---|---|
| Data Centres (Overseas) | 37.8% | North America (13 DCs via 50% JV), Japan (2) |
| Data Centres (Singapore) | 19.2% | Singapore (various) |
| Hi-Tech Buildings | 16.0% | Singapore |
| Business Parks | 12.1% | Singapore |
| Flatted Factories | 9.3% | Singapore |
| Stack-up / Ramp-up | 5.6% | Singapore |
Data centres combined (Singapore + overseas) now account for approximately 57% of MIT’s total AUM — making it more of a data centre REIT with an industrial heritage than a traditional flatted factory landlord.
The North American data centres are held via a 50% joint venture with Mapletree Investments Pte Ltd. This structure means MIT records only its proportionate share of income from these assets, which can make the headline revenue figures look softer than the underlying portfolio performance.
The two Japan properties (one in Tokyo, one in Osaka) were added in late 2024 and early 2025 respectively, expanding MIT’s data centre footprint into the fast-growing Asia-Pacific hyperscaler market. Osaka completed its fit-out in May 2025, and contributions are ramping up in FY2026.
For Singapore investors interested in comparing MIT against a data-centre-pure-play, see our Keppel DC REIT Share Price 2026 deep-dive — which focuses entirely on data centres but trades at a lower yield (~4.2%).
Financials: Gearing, ICR & 3Q FY2026 Results
MIT reported its 3Q FY2026 results (quarter ended December 2025) in late January 2026. The headline numbers reflected the transition year MIT is navigating — but the balance sheet remains solid.
3Q FY2026 Highlights (quarter ended December 2025):
| Metric | 3Q FY2026 | YoY Change |
|---|---|---|
| DPU | 3.17¢ | –7.0% |
| Gross Revenue | S$163.1M | –8.0% |
| Net Property Income (NPI) | S$122.8M | –7.8% |
| Aggregate Leverage | 37.3% | Improved |
| Interest Coverage Ratio (ICR) | 3.9x | Stable |
The revenue and NPI declines were primarily due to three factors: (1) income vacuum from three Singapore properties divested in August 2025; (2) non-renewals by some North American data centre tenants; and (3) a weaker USD reducing overseas income in SGD terms.
The gearing story is actually positive: MIT used divestment proceeds to repay borrowings, reducing aggregate leverage to 37.3% — well within MAS’s 50% regulatory cap, and among the lowest gearing ratios in the S-REIT industrial sector. With an ICR of 3.9x against MAS’s 1.5x minimum, MIT has ample financial buffer.
Lower gearing also means MIT has approximately S$2–2.5B in debt headroom for acquisitions (assuming it maintains leverage comfortably below 40%). This acquisition capacity is meaningful given the data centre pipeline in Japan and potential North American opportunities.
To model MIT’s gearing vs the MAS regulatory threshold, try our S-REIT Gearing Ratio & ICR Calculator.

Peer Yield Comparison: MIT vs Industrial S-REIT Peers
How does MIT stack up against its Singapore industrial and data centre REIT peers in terms of dividend yield? Here is a snapshot as at April 2026:
| REIT | SGX Ticker | Dividend Yield (Apr 2026) | Gearing |
|---|---|---|---|
| Mapletree Industrial Trust | ME8U | ~6.9% | 37.3% |
| CapitaLand Ascendas REIT | A17U | ~5.8% | ~38% |
| AIMS APAC REIT | O5RU | ~7.3% | ~33% |
| Sabana REIT | M1GU | ~7.1% | ~32% |
| ESR-LOGOS REIT | J91U | ~8.2% | ~40% |
| Keppel DC REIT | AJBU | ~4.2% | ~35% |
Yields are approximate trailing yields based on April 2026 share prices and most recent full-year DPU. Not financial advice. Always verify current prices.
MIT’s ~6.9% yield sits comfortably in the middle of the industrial S-REIT pack — higher than the larger, more liquid CapitaLand Ascendas REIT (A17U) but lower than smaller peers like ESR-LOGOS REIT (J91U) which carry higher risk. Against Keppel DC REIT (AJBU), MIT offers a significantly higher yield (6.9% vs 4.2%) with comparable data centre exposure — the trade-off is MIT’s mixed industrial portfolio vs Keppel DC’s pure data centre focus.
For a full S-REIT yield comparison across all sectors, see our regularly updated Best S-REITs Singapore 2026 Guide.
Key Risks to Watch
1. North American Data Centre Occupancy
MIT’s North American data centres — held via a 50% JV with Mapletree Investments — have faced tenant non-renewals in FY2026, contributing to softer revenue. If occupancy continues to slip, DPU pressure could persist into FY2027. Management is actively re-leasing, but this is the key near-term watch item.
2. USD/SGD Currency Risk
With over 37% of AUM in USD-denominated North American assets, a weaker USD reduces MIT’s distributable income when converted to SGD. The USD has been under pressure in early 2026 amid tariff uncertainty — this headwind could linger.
3. Interest Rate Sensitivity
Like all S-REITs, MIT’s DPU is sensitive to changes in borrowing costs. While gearing is low at 37.3%, any sustained higher-for-longer rate environment caps DPU recovery. On the flip side, rate cuts would be a meaningful tailwind — the Fed held rates in March 2026 with one cut now priced in for late 2026.
4. Singapore Industrial Property Market
MIT still derives significant NPI from Singapore’s hi-tech buildings and business parks. If Singapore’s industrial market softens (vacancy rises, rental reversions turn negative), this would weigh on the SGD-denominated income base.
5. Acquisition Execution Risk
MIT’s growth strategy depends on accretive data centre acquisitions. If acquisitions are overpriced or underperform (as seen with some North American DCs), the thesis weakens. Unitholders should monitor deal announcements closely.
Is MIT Worth Buying in 2026?
Mapletree Industrial Trust offers a compelling proposition for Singapore dividend investors who want data centre exposure without paying the premium valuation of a pure-play like Keppel DC REIT. At ~6.9% yield and 37.3% gearing, MIT balances income and financial resilience well.
The DPU has been broadly stable over five years — declining by only 1% in the bad year (FY2024) and recovering to a record high in FY2025. That kind of consistency is rare in a rate-volatile environment and reflects the quality of MIT’s tenant base (largely blue-chip technology and industrial tenants on long leases).
The transition year narrative for FY2026 is well-flagged and largely priced in. The key upside drivers are: (a) North American data centre re-leasing, (b) ramping contributions from the Tokyo and Osaka acquisitions, and (c) potential Fed rate cuts improving MIT’s cost of debt and re-rating the share price.
For context, MIT currently trades at a modest discount to NAV (estimated P/NAV of approximately 0.85–0.90x at S$1.97), which is typical for the current S-REIT environment. A mean reversion toward NAV — historically seen when rates plateau and start falling — would represent capital upside in addition to the ~6.9% yield.
Bottom line for Singapore investors: MIT is a well-managed, data-centre-oriented industrial REIT offering a solid 6.9% yield with conservative gearing. It suits income investors who want quarterly distributions, data centre thematic exposure, and a proven sponsor (Mapletree). The main risks (USD weakness, North America occupancy) are near-term and manageable if you have a medium-term investment horizon of 2–3 years. Always do your own research and consult a licensed financial adviser.
For platform options to invest in MIT via CPF or SRS, explore our Endowus Referral Code or Syfe Referral Code pages for current promotions.
FAQ: Mapletree Industrial Trust (ME8U)
What is Mapletree Industrial Trust’s current share price?
What is MIT’s dividend yield in 2026?
How often does MIT pay dividends?
Is MIT a data centre REIT or industrial REIT?
What is MIT’s gearing ratio?
Can I buy MIT using CPF or SRS funds?
How does MIT compare to Keppel DC REIT?
What are the risks of investing in MIT?
Explore More S-REIT Deep-Dives & Tools
Continue your S-REIT research with these resources from The Kopi Notes:
Disclaimer: This article is for informational and educational purposes only. It does not constitute financial advice or a recommendation to buy or sell any security. All data as at April 2026. Past performance of DPU or share price does not guarantee future results. Please consult a MAS-licensed financial adviser before making investment decisions. TheKopiNotes.com is not responsible for any investment losses incurred.
This article was researched with the help of AI. While we strive to keep all information accurate and up to date, there may be errors. If you notice any discrepancies, please contact us.