Mapletree Industrial Trust Share Price, Dividend & Yield Analysis 2026
Mapletree Industrial Trust (SGX: ME8U) is one of Singapore’s largest diversified industrial S-REITs, with a portfolio spanning flatted factories, hi-tech buildings, business park properties, and a significant data centre segment spanning North America and Asia. This guide covers ME8U’s current share price drivers, dividend per unit (DPU) history, yield analysis, gearing metrics, and what investors should know heading into 2026. This is not financial advice. All data referenced as at April 2026.
Mapletree Industrial Trust (MIT) has evolved from a purely Singapore-focused industrial landlord into a globally diversified data-centre-heavy REIT. With approximately 50% of its assets by value now in data centres — primarily in the United States — MIT sits at the intersection of Singapore’s traditional industrial REIT sector and the booming global digital infrastructure theme.
In this comprehensive guide, we break down MIT’s portfolio, track its share price trajectory, analyse its DPU trend, compare its yield against peers, and flag the key risks and catalysts investors should watch in 2026.
Table of Contents
Contents — Click to expand
- MIT at a Glance — Key Stats 2026
- Portfolio Breakdown — Industrial & Data Centres
- Share Price History & Key Levels
- DPU History & Dividend Track Record
- Dividend Yield Analysis — Is MIT a Good Yield Play?
- Gearing & Balance Sheet Health
- MIT vs S-REIT Peers — Yield Comparison Table
- Growth Catalysts & Risks in 2026
- How to Invest in MIT via CPF/SRS
- FAQ — Mapletree Industrial Trust
MIT at a Glance — Key Stats 2026
Here is a quick-reference snapshot of Mapletree Industrial Trust’s key metrics as at April 2026:
| Metric | Value |
|---|---|
| SGX Ticker | ME8U |
| REIT Manager | Mapletree Industrial Trust Management Ltd |
| Sponsor | Mapletree Investments (Temasek subsidiary) |
| Market Cap | ~S$5.8 billion |
| No. of Properties | 143 (SG + US) |
| Total AUM | ~S$9.0 billion |
| Annualised DPU (FY2025) | ~12.74 Singapore cents |
| Dividend Yield (approx.) | ~5.8–6.2% (based on S$2.05–2.20 price range) |
| Gearing Ratio | ~36.0% |
| Interest Coverage Ratio | ~4.5x |
| Distribution Frequency | Quarterly |
| Data Centre % of Portfolio | ~50% (by valuation) |
Sources: MIT investor relations, SGX filings. Data as at April 2026. Yield calculated on approximate price — verify current price on SGX or your brokerage.

Portfolio Breakdown — Industrial & Data Centres
MIT’s portfolio has undergone a dramatic transformation since its IPO in 2010. What began as a Singapore-only flatted factory and light industrial REIT has grown into a diversified industrial-cum-data-centre platform spanning two continents. As at Q4 FY2025, MIT’s portfolio can be broken down as follows:
| Segment | Properties | % of Portfolio Value | Location |
|---|---|---|---|
| Data Centres | 56 | ~50% | USA, SG, JPN |
| Hi-Tech Buildings | 16 | ~19% | Singapore |
| Flatted Factories | 35 | ~13% | Singapore |
| Business Park Buildings | 18 | ~10% | Singapore |
| Stack-Up / Ramp-Up | 18 | ~8% | Singapore |
The data centre segment — particularly through its 50.01% stake in the Mapletree Rosewood Data Centre Trust (MRDT) — has been MIT’s key differentiator and growth engine. US hyperscale data centres generate USD-denominated income, providing both geographic diversification and a hedge to Singapore’s export-oriented economy.
The Singapore industrial properties (flatted factories, hi-tech buildings, business parks) underpin MIT’s resilient base income with long-term master lease structures and strong occupancy — typically above 92–95% — driven by demand from precision engineering, semiconductor supply-chain, logistics, and R&D tenants.
Share Price History & Key Levels
MIT’s share price has been on a multi-year consolidation after peaking above S$3.00 in the 2021 post-COVID boom. The rate-hiking cycle from 2022 to 2024 compressed REIT valuations globally, and MIT was not spared — the unit price fell to a trough near S$2.00 in 2023 before recovering modestly.
Here is a simplified price timeline for context:
| Period | Approx. Price Range (S$) | Key Driver |
|---|---|---|
| 2020 (COVID trough) | 1.80 – 2.40 | Pandemic uncertainty; industrial demand held up |
| 2021 (peak) | 2.70 – 3.10 | Data centre boom; low interest rate environment |
| 2022–2023 (rate-hike pressure) | 2.00 – 2.60 | Rising SIBOR/SOFR; higher cost of debt, DPU pressure |
| 2024 (rate-cut hopes) | 2.10 – 2.40 | Fed pivot narrative; data centre lease renewals positive |
| 2025–2026 (current) | 2.00 – 2.25 | Tariff uncertainty; USD/SGD FX impact on US DC income |
Key support level to watch: S$2.00 — this level has historically attracted buying interest and represents roughly a 6.4% forward yield at current DPU levels, which tends to be compelling for long-term income investors.
Key resistance: S$2.30–2.40 — this range corresponded to MIT’s NAV per unit in prior periods and requires a meaningful rate environment improvement or DPU growth to break convincingly higher.
For the most current ME8U share price, check SGX or your brokerage platform.
DPU History & Dividend Track Record
MIT distributes quarterly — one of the key advantages for income investors who prefer a steady cash flow stream rather than semi-annual or annual payouts. Below is MIT’s DPU history over recent financial years (MIT’s financial year ends 31 March):
| Financial Year | Full-Year DPU (S cents) | YoY Change | Notes |
|---|---|---|---|
| FY2021/22 | 13.70 | +7.9% | Strong data centre contribution |
| FY2022/23 | 13.59 | -0.8% | Rate headwinds; higher financing costs |
| FY2023/24 | 13.04 | -4.0% | US DC rent resets; FX drag from USD weakness |
| FY2024/25 (est.) | ~12.74 | ~-2.3% | Stabilising; new DC leases contributing |
The DPU decline from the FY2022 peak reflects a combination of: higher interest expense as floating-rate loans repriced with SOFR/SIBOR; FX headwinds as USD income converted to SGD at less favourable rates; and some vacancies during US data centre lease transitions.
The positive read-through for 2026: MIT has been actively locking in new data centre leases at higher rental rates, and rate cuts — if they materialise — will meaningfully reduce financing costs and support DPU recovery. Many market analysts project DPU stabilisation or modest recovery in FY2025/26.
If you want to model your own MIT income projections, use The Kopi Notes’ S-REIT Dividend Yield Calculator or the Dividend Portfolio Yield Calculator to see what a given MIT position would generate for your portfolio.
Dividend Yield Analysis — Is MIT a Good Yield Play?
At a share price around S$2.05–2.20 and a trailing DPU of roughly 12.74 Singapore cents, MIT currently offers a dividend yield in the range of 5.8% to 6.2%. Here is how that stacks up against different reference points:
| Reference Point | Rate / Yield | MIT Spread |
|---|---|---|
| Singapore 10-Year SGS Bond | ~2.8–3.0% | +280–320 bps |
| 6-Month T-Bill | ~3.5–3.8% | +220–270 bps |
| CPF OA Rate | 2.5% | +330–370 bps |
| Endowus Cash Smart / Syfe Cash+ | ~3.5–4.0% | +200–270 bps |
| Fixed Deposit (12-month) | ~2.8–3.2% | +270–340 bps |
A spread of +250–350 basis points over risk-free alternatives has historically been the “fair value” range for investment-grade Singapore industrial REITs. MIT currently sits at the upper end of that range, suggesting it is not overvalued — but the spread also reflects genuine risk premia: US data centre lease uncertainty, FX exposure, and macro uncertainty from global tariff disruption.
Tax treatment reminder: Singapore REITs distributed to individual retail unitholders are generally tax-exempt at the individual level, unlike dividends from ordinary stocks which are not taxed at the corporate tax rate for individuals (Singapore has a one-tier tax system). This makes REIT distributions especially tax-efficient for Singapore-resident investors compared with earning interest from savings accounts or fixed deposits at marginal income tax rates.
To compare MIT’s yield versus the Singapore Government Securities (SGS) bond spread in real time, try the S-REIT Yield vs SGS Bond Spread Calculator.
Gearing & Balance Sheet Health
Understanding a REIT’s balance sheet is critical for assessing distribution sustainability. MIT’s key balance sheet metrics as at Q3 FY2025:
| Metric | Value | Assessment |
|---|---|---|
| Aggregate Leverage (Gearing) | ~36% | Comfortable — MAS cap is 50%; headroom intact |
| Interest Coverage Ratio (ICR) | ~4.5x | Above the MAS 1.5x minimum; healthy |
| % Fixed-Rate Debt | ~80% | Protects DPU from floating rate spikes |
| Weighted Avg. Debt Maturity | ~4.5 years | Well-staggered; no near-term refinancing cliff |
| Avg. Cost of Debt | ~3.0–3.3% | Manageable relative to portfolio NPI yield |
| NAV per Unit | ~S$2.15–2.25 | P/NAV near 0.95–1.00 at current prices |
MIT’s 36% gearing is well below the 50% MAS limit, giving management ample debt headroom for acquisitions or developments without needing to issue new equity at the current depressed unit price. The high proportion of fixed-rate debt (~80%) insulates distributions from floating-rate volatility — a key reason why MIT’s DPU has been more resilient than peers with higher floating-rate exposure.
For a deeper gearing analysis across multiple S-REITs, use the S-REIT Gearing Ratio & ICR Calculator.
MIT vs S-REIT Peers — Yield Comparison Table
How does MIT stack up against comparable Singapore industrial and data-centre-linked REITs? Here is a peer comparison as at April 2026 (approximate figures — verify on SGX for current data):
| REIT | Ticker | Approx. Yield | Gearing | Key Focus |
|---|---|---|---|---|
| Mapletree Industrial Trust | ME8U | ~6.0% | 36% | Industrial + Data Centres (US/SG) |
| Keppel DC REIT | AJBU | ~4.5–5.0% | 31% | Pure-play Data Centres (Global) |
| CapitaLand Ascendas REIT | A17U | ~5.8–6.2% | 38% | Diversified Industrial (Global) |
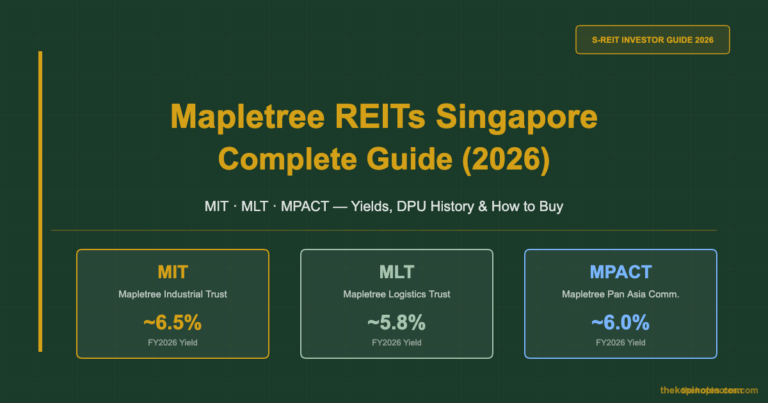
| Mapletree Logistics Trust | M44U | ~6.5–7.0% | 40% | Logistics & Warehousing (Pan-Asia) |
| AIMS APAC REIT | O5RU | ~7.0–7.5% | 33% | Industrial SG + Australia |
MIT commands a slight yield premium over Keppel DC REIT (which is re-rated higher on pure data centre sentiment) and sits in-line with CapitaLand Ascendas REIT — a close peer in terms of portfolio size and diversification. Mapletree Logistics Trust and AIMS APAC REIT offer higher raw yields, but with greater China and smaller-market exposure respectively.
See our full Best S-REITs Singapore 2026 guide for a broader comparison across all major Singapore-listed REITs.
Growth Catalysts & Risks in 2026
Upside Catalysts
1. Data Centre Demand Surge (AI Infrastructure Tailwind): The explosion in AI model training and inference is driving unprecedented demand for data centre capacity globally. MIT’s US data centres — concentrated in major US colocation markets — are well-positioned to benefit from hyperscaler expansion. New or renewed leases at higher rental rates can meaningfully lift DPU from FY2026 onwards.
2. Interest Rate Cuts: If the US Federal Reserve continues cutting rates, MIT’s US dollar-denominated financing costs will decline. With ~80% of debt at fixed rates, the impact is gradual but meaningful as fixed-rate tranches mature and are refinanced at lower rates over 2025–2027.
3. Singapore Industrial Rents Holding Up: JTC data shows Singapore industrial rents remaining firm in key segments (hi-tech, business parks) with low vacancy in established industrial estates. MIT’s Singapore portfolio — which anchors its stable income base — remains resilient.
4. Sponsor Pipeline: As a Temasek subsidiary, Mapletree Investments has a large portfolio of logistics, commercial, and industrial assets globally that can serve as an acquisition pipeline for MIT. Sponsor support also provides access to capital on favourable terms.
Key Risks
1. USD/SGD FX Headwind: Approximately 50% of MIT’s income is USD-denominated. A stronger SGD or weaker USD reduces DPU when converted to Singapore cents. In a risk-off macro environment where the USD weakens, this is a direct DPU headwind.
2. US Tariff & Trade Policy Uncertainty: The 2025–2026 tariff environment has created uncertainty for US manufacturing and tech supply chains. While data centres themselves are not directly tariffed, a prolonged economic slowdown could dampen demand from hyperscaler clients and delay capacity expansion plans.
3. Data Centre Lease Concentration Risk: MIT’s US DC portfolio has a handful of large hyperscale tenants. Non-renewal of a major lease — even with advance notice — can create temporary income gaps and market sentiment pressure on the unit price.
4. Equity Dilution Risk: If MIT pursues large acquisitions, it may need to issue new units. At current prices near or below NAV, equity fundraising is dilutive to existing unitholders. Management has been disciplined here, but it remains a watch point.
How to Invest in MIT via CPF/SRS
Mapletree Industrial Trust (ME8U) is approved for investment using CPF Investment Scheme (CPFIS) Ordinary Account (OA) funds, subject to the CPFIS investment limits and risk classification requirements. It is also eligible for Supplementary Retirement Scheme (SRS) investment.
CPF OA Investment
To invest CPF OA funds in ME8U, you need a CPFIS-approved agent bank (DBS/OCBC/UOB) linked to a CDP brokerage account. Key considerations:
You can invest up to 35% of your investible savings (CPF OA balance above S$20,000) in Singapore-listed stocks and REITs including MIT. MIT is classified as a “higher risk” investment under CPFIS — you must be aware of this risk classification before investing CPF funds. Returns from ME8U distributions invested via CPF go back into your CPF OA account and earn the OA rate until withdrawal.
For a CPF investment strategy guide and to understand how REIT yields compare against leaving money in CPF OA at 2.5%, read our CPF Investment Strategy Guide.
SRS Investment
SRS funds can be used to purchase ME8U via your SRS-linked brokerage account. SRS contributions reduce your taxable income in the year of contribution (up to the annual cap of S$15,300 for Singapore citizens/PRs). Distributions received into your SRS account accumulate tax-deferred until withdrawal at statutory retirement age. This makes MIT an efficient SRS holding if you expect a long holding period and prefer quarterly income compounding inside the SRS wrapper.
Model your SRS tax savings with our SRS Tax Savings Calculator.
Platforms Where You Can Buy ME8U
For Singapore investors, MIT (ME8U) is available on all major retail brokerage platforms. If you are looking for a low-cost, user-friendly option for building an S-REIT income portfolio, consider:
FAQ — Mapletree Industrial Trust (ME8U)
What is Mapletree Industrial Trust (MIT)?
What is the current MIT share price and dividend yield?
How often does MIT pay dividends?
Is MIT a good REIT to buy in 2026?
Can I invest in MIT with CPF or SRS?
What is MIT's gearing ratio and how does it compare to other REITs?
What is the difference between MIT and Keppel DC REIT?
Useful Tools & Guides
Build your S-REIT portfolio with data — use our free Singapore investing tools:
- S-REIT Dividend Yield Calculator — Model your MIT income projections
- Gearing & ICR Calculator — Compare MIT gearing vs peers
- REIT vs SGS Bond Spread Calculator — Is MIT yield attractive vs risk-free?
- SRS Tax Savings Calculator — Model SRS benefits for REIT investing
- Best S-REITs Singapore 2026 — Full S-REIT comparison guide
This article was researched with the help of AI. While we strive to keep all information accurate and up to date, there may be errors. If you notice any discrepancies, please contact us.