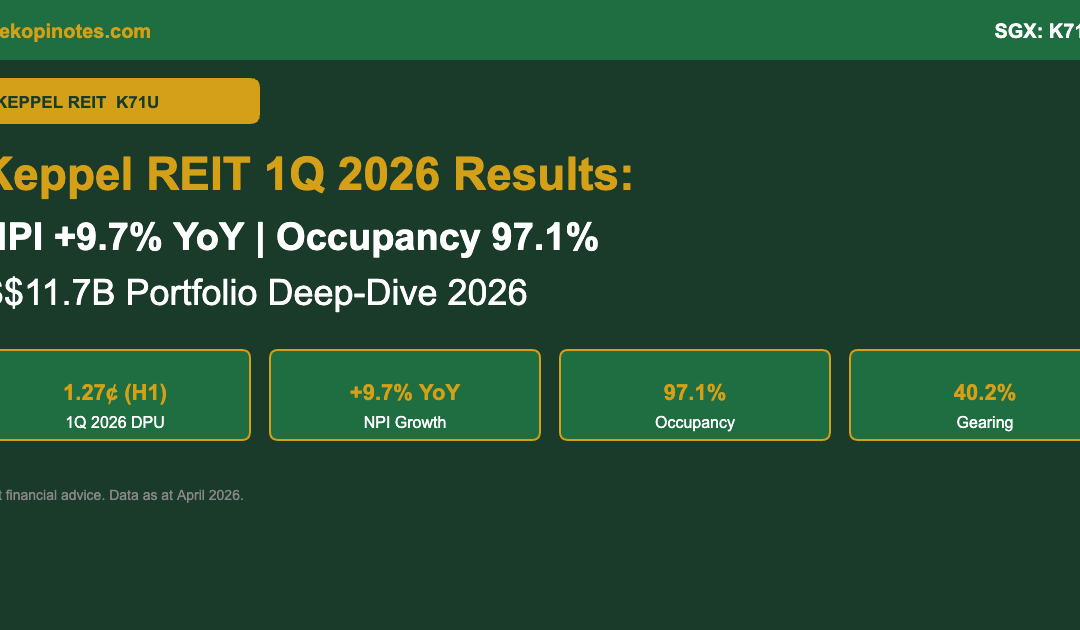
Keppel REIT 1Q 2026 Results: NPI +9.7%, Occupancy 97.1% & S$11.7B Portfolio Deep-Dive
Keppel REIT (SGX: K71U) delivered a solid first quarter in 2026 — net property income jumped 9.7% year-on-year, portfolio occupancy hit 97.1%, and the recent MBFC Tower 3 and Top Ryde City acquisitions are already contributing to income. This article breaks down the 1Q 2026 numbers, DPU history, yield comparison, and what it all means for Singapore investors.
Disclaimer: This article is for informational purposes only and does not constitute financial advice. Always conduct your own due diligence before making investment decisions. Data sourced from Keppel REIT SGX filings as at April 2026.
Keppel REIT Overview
Keppel REIT (SGX: K71U) is one of Singapore’s largest commercial office REITs, with a S$11.7 billion portfolio spanning Grade A office and mixed-use assets across Singapore, Australia, South Korea, and Japan. The REIT pays distributions semi-annually in June and December.
| Metric | Value (Mar 2026) |
|---|---|
| SGX Ticker | K71U |
| Portfolio Value | S$11.7 billion |
| Units in Issue | ~4,955 million |
| FY2025 DPU | 5.23 cents (–6.6% YoY) |
| Indicative Yield | ~6.1% |
| Aggregate Leverage | 40.2% |
1Q 2026 Financial Highlights
Keppel REIT reported strong first-quarter results for 2026, driven by Top Ryde City Shopping Centre, higher occupancy at Ocean Financial Centre, and the additional MBFC Tower 3 stake acquired in late 2025.
| Metric | 1Q 2026 | 1Q 2025 | YoY |
|---|---|---|---|
| Gross Revenue | S$78.6M | S$68.7M | +14.4% |
| Net Property Income | S$59.9M | S$54.6M | +9.7% |
| NPI Attributable | S$54.7M | S$50.1M | +9.1% |
| Share of JV Results | S$41.7M | S$30.3M | +37.6% |
| Portfolio Occupancy | 97.1% | 96.7% | +0.4pp |
| Rental Reversion | +17.2% | — | — |
| Est. 1Q DPU (H1 portion) | 1.27 cents | — | — |
The +17.2% positive rental reversion is particularly encouraging — banking, insurance and financial services firms accounted for 73.9% of new leasing demand in 1Q 2026.
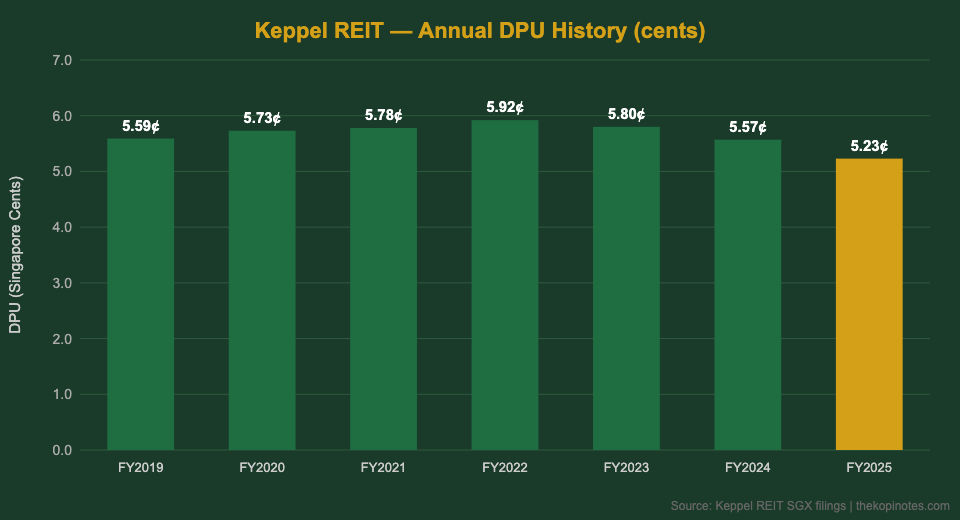
DPU History FY2019–FY2025
Keppel REIT peaked at 5.92 cents DPU in FY2022 before declining due to rising interest costs and equity dilution. FY2025 DPU came in at 5.23 cents, down 6.6% year-on-year — but the improving 1Q 2026 operational metrics suggest the worst may be behind.
| FY | DPU (cents) | YoY |
|---|---|---|
| FY2019 | 5.59¢ | — |
| FY2020 | 5.73¢ | +2.5% |
| FY2021 | 5.78¢ | +0.9% |
| FY2022 | 5.92¢ | +2.4% |
| FY2023 | 5.80¢ | –2.0% |
| FY2024 | 5.57¢ | –3.9% |
| FY2025 | 5.23¢ | –6.1% |
Portfolio Breakdown: S$11.7B Across 5 Markets
Keppel REIT’s 12 assets are spread across Singapore (~65%), Australia (~22%), South Korea (~8%), and Japan (~3%). WALE across the portfolio is ~4.4 years; top 10 tenants average 8.0 years WALE. Over 450,000 sq ft was committed in 1Q 2026 alone.
| Market | Key Assets | Est. Weight |
|---|---|---|
| Singapore | MBFC T1/T2/T3, Ocean Financial Centre, One Raffles Quay | ~65% |
| Australia | 8 Exhibition St (Melbourne), 275 George St (Sydney), Pinnacle Office Park | ~22% |
| South Korea | T Tower, Namu Tower (Seoul) | ~8% |
| Japan | Keppel Bay Tower (Tokyo) | ~3% |
| Australia (Retail) | Top Ryde City Shopping Centre | ~2% |
MBFC Tower 3 & Top Ryde City Acquisitions
MBFC Tower 3 (additional 1/3 interest): Keppel REIT acquired an additional one-third interest in Marina Bay Financial Centre Tower 3, funded partly via a preferential offering. The Share of JV Results jumped 37.6% to S$41.7M in 1Q 2026, directly reflecting this acquisition’s earnings contribution.
Top Ryde City Shopping Centre: This suburban retail asset in Ryde, New South Wales (Australia) is Keppel REIT’s first foray into retail real estate. It contributed to the 14.4% gross revenue uplift in 1Q 2026. Both acquisitions are expected to become accretive as income stabilises through 2026–2027.
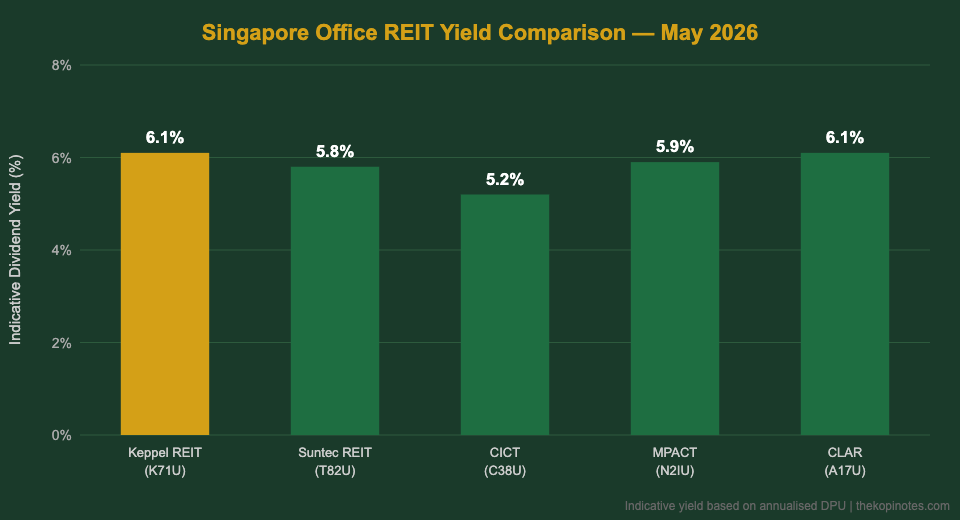
Yield Comparison vs Singapore Office REIT Peers
At ~S$0.86 per unit, Keppel REIT offers an indicative yield of ~6.1% — among the highest in the Singapore office REIT peer group. You can compare S-REIT yields against risk-free rates using the S-REIT Yield vs SGS Bond Spread Calculator.
| REIT | Latest DPU | Gearing | Yield |
|---|---|---|---|
| Keppel REIT (K71U) | 5.23¢ | 40.2% | ~6.1% |
| Suntec REIT (T82U) | 6.40¢ | ~42.5% | ~5.8% |
| CICT (C38U) | 10.88¢ | ~38.2% | ~5.2% |
| MPACT (N2IU) | 7.97¢ | 36.5% | ~5.9% |
| CLAR (A17U) | 15.00¢ | 39.0% | ~6.1% |
Indicative yields based on annualised DPU / recent share price. Not a recommendation. Data as at May 2026.
Gearing & Debt Analysis
Aggregate leverage at 40.2% (as at 31 March 2026) is within the MAS 50% cap but elevated. ~S$1.2 billion in loans mature within the next 12 months — successful refinancing in a SORA easing environment could be a tailwind to distributable income. Use the S-REIT Gearing Ratio & ICR Calculator to model the impact of different leverage scenarios. For the broader S-REIT rate outlook, see our S-REIT Outlook 2026.
Analyst Outlook & Target Prices
Analyst consensus target prices range from S$0.90 (Citi, Neutral) to S$1.20 (bull case Buy), with the average consensus around S$1.10–S$1.20. At ~S$0.86–0.89, Keppel REIT trades at a meaningful discount to NAV and consensus targets. The bull thesis: continued positive rental reversions, SORA rate cuts, and accretive income from new acquisitions flowing through by 2H 2026. For a broader S-REIT comparison, see Best S-REITs Singapore 2026.
How to Buy Keppel REIT with CPF / SRS
Keppel REIT (SGX: K71U) is CPFIS-OA approved and SRS eligible. Recommended platforms:
- FSMOne (referral: P0544985) — low brokerage 0.08% min S$10. See our FSMOne referral page.
- Syfe REIT+ — managed S-REIT portfolio. Referral: TKNSG.
- Endowus — best for CPF/SRS investing. Endowus referral.
Model your income with the REITs Dividend Yield Calculator and total returns with the S-REIT Total Return Calculator.
Frequently Asked Questions
What was Keppel REIT's DPU for 1Q 2026?
What is Keppel REIT's current dividend yield?
Why did Keppel REIT's DPU decline in FY2025?
What is the gearing ratio of Keppel REIT in 2026?
What was the rental reversion for Keppel REIT in 1Q 2026?
Is Keppel REIT eligible for CPF investment?
What properties does Keppel REIT own in Singapore?
What is the analyst target price for Keppel REIT in 2026?
This article was researched with the help of AI. While we strive to keep all information accurate and up to date, there may be errors. If you notice any discrepancies, please contact us.