CapitaLand Ascendas REIT (CLAR) 1H2026 Results: Distributable Income Up 8.6% to S$359.4M, DPU Stable at 7.482 Cents (SGX: A17U)
Gross revenue climbs 6.7% YoY, occupancy holds at 89.1%, and leverage edges up to 39.7% after S$1.8 billion of acquisitions
CapitaLand Ascendas REIT (SGX: A17U) reported 1H2026 distributable income of S$359.4 million, up 8.6% year-on-year, on 5 August 2026. DPU held stable at 7.482 Singapore cents. Gross revenue rose 6.7% to S$805.5 million, driven by S$1.8 billion in acquisitions across data centres, logistics and business parks, though occupancy dipped slightly to 89.1% and leverage rose to 39.7%.
Not financial advice. All figures are for educational reference only. Data as at August 2026 unless noted.
- Distributable income grew 8.6% YoY to S$359.4M, but DPU was flat at 7.482 cents because CLAR issued more units to fund S$1.8B of acquisitions.
- Leverage rose to 39.7% (from 37.4% a year ago) — still well under the 50% MAS ceiling, with S$4.3B of debt headroom left.
- Occupancy slipped to 89.1% overall, dragged down by a newly acquired 80.9%-occupied US portfolio; rental reversions stayed strong at +8.5%.
Table of Contents
Contents — Click to expand
- CLAR 1H2026 Key Results at a Glance
- DPU: Why It’s Flat Despite Higher Income
- Acquisitions, Divestments & Developments
- Occupancy and Rental Reversions by Region
- Balance Sheet: Leverage, Debt Cost & Headroom
- Outlook: What Management Is Watching
- What This Means for Singapore Investors
- Frequently Asked Questions
CLAR 1H2026 Key Results at a Glance
CapitaLand Ascendas REIT (CLAR) released its 1H2026 financial results on 5 August 2026, covering the six months ended 30 June 2026. If you already hold CLAR units, or you’re weighing whether to add Singapore’s largest business space and industrial REIT to your portfolio, here’s the full breakdown of what changed.
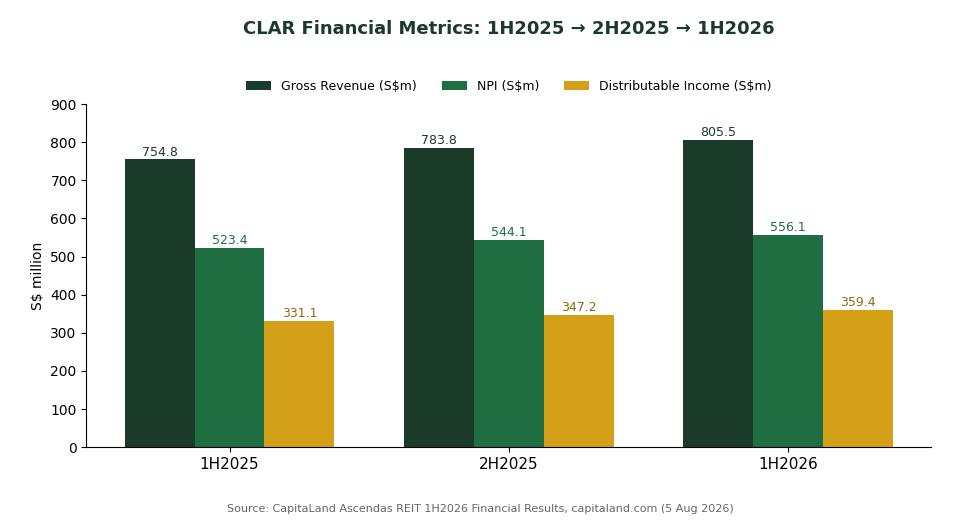
Distributable income (DI) rose 8.6% year-on-year to S$359.4 million. That’s the cash CLAR actually has available to pay out to unitholders. However, distribution per unit (DPU) — the number that determines what lands in your CDP account — stayed almost flat at 7.482 cents. That gap is the story of this results season, and we’ll unpack why below.
| Metric | 1H2025 | 2H2025 | 1H2026 | YoY Change |
|---|---|---|---|---|
| Gross Revenue (S$m) | 754.8 | 783.8 | 805.5 | +6.7% |
| Net Property Income (S$m) | 523.4 | 544.1 | 556.1 | +6.2% |
| Distributable Income (S$m) | 331.1 | 347.2 | 359.4 | +8.6% |
| DPU (cents) | 7.477 | 7.528 | 7.482 | +0.1% |
| Aggregate Leverage | 37.4% | 39.0% | 39.7% | +2.3 ppt |
Source: CapitaLand Ascendas REIT 1H2026 Financial Results, capitaland.com (5 August 2026)
DPU: Why It’s Flat Despite Higher Income
Here’s the part that trips up a lot of investors. CLAR’s actual dollar income went up 8.6%. So why did your DPU barely move?
The answer is unit dilution. CLAR raised fresh equity in both 1H2026 and 1H2025 to fund its acquisition spree. More units outstanding means the same (or even growing) income pool gets sliced into more pieces. Distributable income grew faster than the unit base — but not by enough to meaningfully lift DPU per share.
For 2 April to 30 June 2026, unitholders will receive 3.732 cents per unit, roughly flat against the prior quarter’s 3.750 cents. The record date is 14 August 2026, with payment on 8 September 2026. If you’re holding CLAR through a brokerage, check your account or CDP statement around that date.
This is a common pattern for large-cap S-REITs mid-expansion: income base grows, but per-unit metrics lag until the newly acquired assets are fully contributing and no further equity raises are needed. It’s worth tracking whether DPU starts compounding again once the S$1.8 billion of 1H2026 acquisitions are fully stabilised.
Acquisitions, Divestments & Developments
CLAR didn’t sit still in 1H2026. Management completed or announced roughly S$1.8 billion of acquisitions — nine properties spanning the US, Europe, Singapore and Japan. The two standout deals:
- 49% stake in Osaka Data Centre 1 — CLAR’s push into the AI-driven data centre demand story, following similar moves into Singapore and European data centre assets in prior years.
- Six prime Grade A logistics properties in Spain — expanding the European logistics footprint that already benefits from strong e-commerce-driven demand.
On the other side of the ledger, CLAR proposed divesting the Kim Chuan Telecommunications Complex in Singapore — at double its original purchase price and a 32% premium to its most recent valuation. That’s the kind of capital recycling discipline income investors want to see: sell mature, fully-priced assets to fund growth elsewhere, rather than diluting unitholders further than necessary.
On the development side, CLAR completed 27 IBP (Jurong East), Summerville Logistics Center in the US, and an asset enhancement at Nexus @one-north. Five more projects remain in the pipeline with a combined estimated cost of S$507.2 million — a reminder that the growth capex cycle isn’t over yet.
Occupancy and Rental Reversions by Region
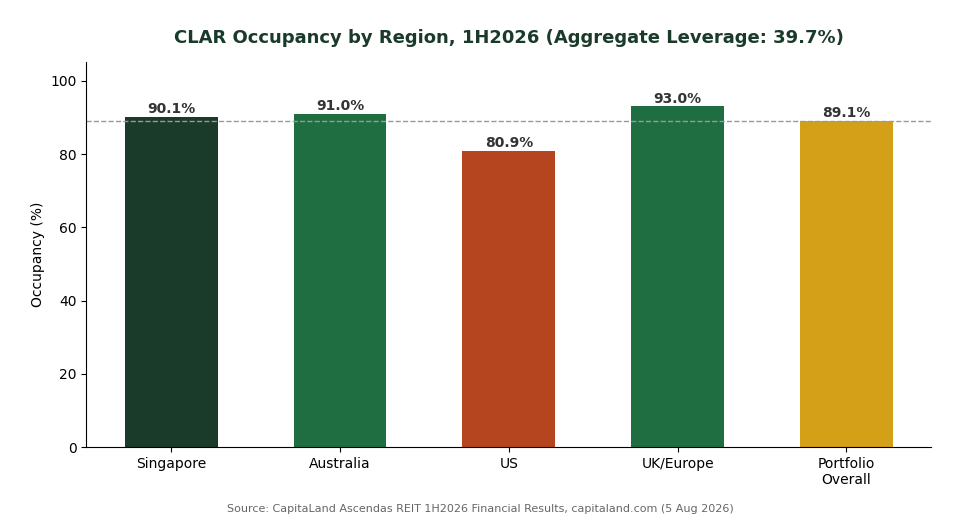
Portfolio-wide occupancy came in at 89.1% as at 30 June 2026, a touch softer than the prior quarter. The main reason: the newly acquired US portfolio is running at just 80.9% occupancy, dragging down an otherwise healthy blended figure.
Break it down by region and the picture is more reassuring. Singapore — still 65% of CLAR’s S$20.1 billion portfolio by value — held steady at 90.1%. Australia sat above 91%, and UK/Europe led the pack at over 93%. It’s really the newer US assets, still being leased up, that are the drag.
Rental reversions — the change in rent when a lease renews compared to its prior rate — averaged +8.5% across 1H2026, with 2Q alone at +5.2%. That’s a healthy sign for organic income growth: even without buying anything new, CLAR is capturing higher rents as existing leases roll over. Management expects reversions to stay in the “high single-digit” range going forward. Weighted Average Lease Expiry (WALE) — basically how much runway is left on the portfolio’s leases before they need renewing — held steady at 4.0 years, with expiries well spread out, reducing the risk of a sudden vacancy cliff.
Balance Sheet: Leverage, Debt Cost & Headroom
Aggregate leverage (basically how much of the portfolio is funded by debt versus unitholder equity) rose to 39.7%, up 2.3 percentage points from 37.4% a year ago. That increase came from funding the S$1.8 billion acquisition spree partly with debt.
Should you be worried? Not particularly. MAS caps S-REIT leverage at 50%, and CLAR still has roughly S$4.3 billion of debt headroom before hitting that ceiling. Cost of debt actually improved slightly to 3.5% (from 3.7% a year ago), interest coverage sits at a comfortable 3.5x, and 70.1% of borrowings are on fixed rates — limiting how much a future rate move could hurt distributions. The portfolio is also 99.6% unencumbered, meaning almost none of it is pledged as collateral, which gives CLAR flexibility to raise secured debt cheaply if needed.
CLAR has also been building out its green financing book: 77% of the portfolio (by floor area) is now green-certified, and S$3.0 billion of borrowings are classified as green financing — relevant if you care about ESG screens on your Singapore REIT ETF or direct-holding portfolio.
Outlook: What Management Is Watching
Management’s tone was cautiously upbeat. They expect rental reversions to stay positive and occupancy to hold up in core markets, supported by the S$507.2 million pipeline of asset enhancement projects still underway. Singapore remains the anchor at 65% of portfolio value, with tech, logistics and life sciences flagged as the most resilient demand drivers heading into the second half.
The main risk flagged wasn’t company-specific — it was macro. Global economic growth is expected to moderate, and geopolitical tensions remain a wildcard that could affect occupancy and rental rates in the medium term, particularly for the US portfolio still in its lease-up phase.
What This Means for Singapore Investors
If you already hold CLAR: this is a “stay the course” result. Income is growing, the balance sheet is healthy, and management is actively recycling capital rather than just piling on debt. The flat DPU isn’t a red flag — it’s the natural cost of an equity-funded growth phase, and it should start showing through in per-unit terms once the newly bought assets are fully leased and stabilised.
If you’re considering a new position: CLAR remains one of the more diversified S-REITs on SGX, spanning business parks, logistics, data centres and life sciences across five developed markets. The ~39.7% leverage and 8.5% rental reversions suggest a REIT still in expansion mode rather than defence mode — worth weighing against your own risk appetite and whether you’d rather buy on a pullback.
Either way, CLAR is a useful data point for anyone tracking S-REIT sector health more broadly. For a fuller picture of how CLAR stacks up against peers, see our best S-REITs in Singapore 2026 roundup, and if you’re building a broader income strategy, our passive income Singapore guide walks through how S-REIT distributions fit alongside other income sleeves. You can also model your own retirement income mix — including REIT distributions — with our free Singapore retirement calculator.
Investors using a CPF Investment Scheme (CPFIS) account to buy CLAR should note this is a CPFIS-included counter; those investing via cash or SRS can review platform fees through our Syfe referral code and sign-up bonus or FSMOne referral code pages, both of which support SGX trading.
Track More S-REIT Results Like This
Get free tools to plan your income portfolio and access to broker referral bonuses.
Frequently Asked Questions
What was CLAR's DPU for 1H2026?
Why did CLAR's income grow but DPU stay flat?
Is CLAR's leverage level safe?
What is CLAR's occupancy rate?
What did CLAR acquire in 1H2026?
Is CapitaLand Ascendas REIT a good buy after 1H2026 results?
What is CLAR's SGX ticker and sector?
This article was researched with the help of AI. While we strive to keep all information accurate and up to date, there may be errors. If you notice any discrepancies, please contact us.