CSPX Historical Returns: Annual Performance & CAGR Since 2016 (2026 Guide)
A Singapore investor’s data-first look at how the iShares Core S&P 500 UCITS ETF has actually performed over the last 10 calendar years, with a worked CAGR calculation and a USD 10,000 growth example.
CSPX (iShares Core S&P 500 UCITS ETF) returned a cumulative 286% in NAV terms over the 10 calendar years from 2016 to 2025, equal to a compound annual growth rate (CAGR) of roughly 14.5% per year, versus 14.2% for its S&P 500 benchmark. A USD 10,000 investment made at the start of 2016 would have grown to approximately USD 38,600 by the end of 2025 — before accounting for the 15% US dividend withholding tax Singapore investors pay on this Ireland-domiciled, LSE-listed ETF.
Not financial advice. All figures are for educational reference only. Data as at 4 November 2026 unless noted, sourced directly from the iShares CSPX factsheet (ishares.com).
Table of Contents
Contents — Click to expand
- What Is CSPX?
- Key Facts at a Glance
- CSPX Calendar-Year Returns (2016–2025)
- Worked CAGR Calculation: USD 10,000 Since 2016
- CSPX vs Its S&P 500 Benchmark: Tracking Difference
- Reading the Numbers: The 2018 and 2022 Drawdowns
- How to Buy CSPX in Singapore
- Who Should Use This Return Data?
- Frequently Asked Questions
What Is CSPX?
CSPX is the London Stock Exchange ticker for the iShares Core S&P 500 UCITS ETF (Acc), an Ireland-domiciled, physically replicated fund that tracks the S&P 500 Index. It is the single most commonly held US large-cap ETF among Singapore investors who buy through brokers like Interactive Brokers (IBKR), moomoo, Saxo and Longbridge, precisely because of the tax treatment covered in our CSPX withholding tax guide. The fund launched on 19 May 2010, holds 504 constituents, and as at 4 November 2026 had USD 159.2 billion in net assets, making it one of the largest S&P 500 UCITS ETFs in the world. It is an accumulating share class — dividends from the underlying 500 companies are reinvested automatically rather than distributed in cash, which is why CSPX’s expense ratio matters more to total return than any visible “yield.”
This article focuses purely on the numbers: what CSPX has actually returned, year by year, and how to turn an annual percentage figure into a usable compounding estimate. If you’re deciding whether to buy CSPX at all, read our S&P 500 ETF Singapore guide first, which compares CSPX against SPYL and VUAA.
Key Facts at a Glance
| Metric | Detail |
|---|---|
| Full Name | iShares Core S&P 500 UCITS ETF USD (Acc) |
| Ticker (LSE) | CSPX (USD) / CSP1 (GBP) |
| Index Tracked | S&P 500 Index |
| Inception / Launch Date | 19 May 2010 |
| Domicile | Ireland |
| Structure | Accumulating, physical replication |
| TER (Expense Ratio) | 0.07% p.a. |
| Net Assets (Fund) | USD 159.2 billion (4 Nov 2026) |
| Number of Holdings | 504 |
| NAV | USD 829.82 (4 Nov 2026); 52-week range USD 681.22–843.55 |
| Securities Lending Return | 0.00% (12 months to 30 Sep 2026) |
Source: iShares CSPX factsheet, ishares.com, data as at 4 November 2026.
CSPX Calendar-Year Returns (2016–2025)
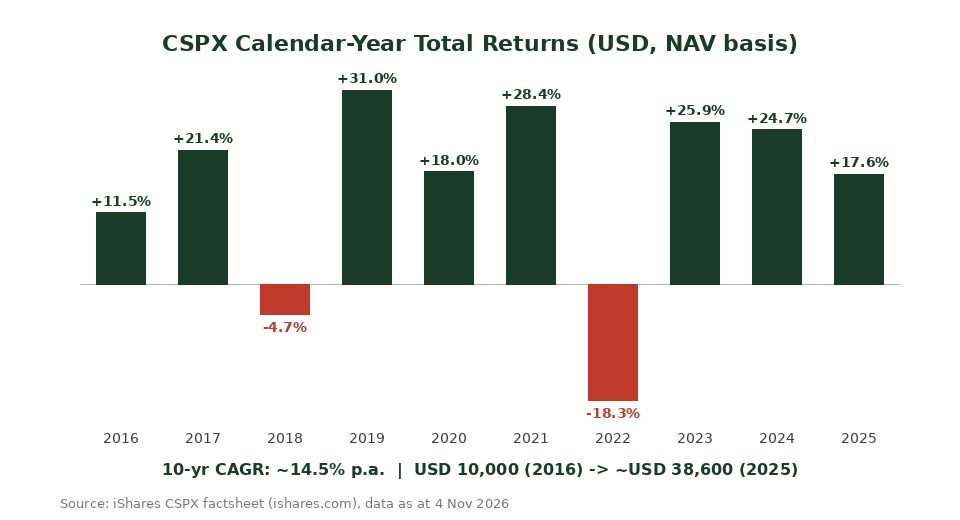
The table below shows CSPX’s published NAV total return for each of the last 10 calendar years, alongside its S&P 500 benchmark return for the same year. These are the exact figures BlackRock publishes on the fund’s official factsheet — not a third-party estimate.
| Year | CSPX NAV Return (USD) | S&P 500 Benchmark Return (USD) |
|---|---|---|
| 2016 | +11.5% | +11.2% |
| 2017 | +21.4% | +21.1% |
| 2018 | -4.7% | -4.9% |
| 2019 | +31.0% | +30.7% |
| 2020 | +18.0% | +17.8% |
| 2021 | +28.4% | +28.2% |
| 2022 | -18.3% | -18.5% |
| 2023 | +25.9% | +25.7% |
| 2024 | +24.7% | +24.5% |
| 2025 | +17.6% | +17.4% |
Source: iShares CSPX factsheet (Calendar Year performance table), ishares.com, data as at 4 November 2026. Figures are NAV total return in USD with gross income reinvested; past performance does not guarantee future returns.
Worked CAGR Calculation: USD 10,000 Since 2016
A simple average of the 10 annual returns above is misleading — it ignores compounding and the fact that a -18.3% year (2022) needs a larger subsequent gain just to recover the lost base. The correct measure is the Compound Annual Growth Rate (CAGR), calculated by multiplying each year’s growth factor together and taking the 10th root.
Multiplying the 10 annual growth factors for CSPX (1.115 × 1.214 × 0.953 × 1.310 × 1.180 × 1.284 × 0.817 × 1.259 × 1.247 × 1.176) gives a cumulative growth factor of approximately 3.86x, meaning a dollar invested at the start of 2016 was worth roughly USD 3.86 by the end of 2025 — a cumulative gain of about 286%. Taking the 10th root of 3.86 gives a CAGR of approximately 14.5% per year.
In concrete terms: a Singapore investor who put USD 10,000 into CSPX at the start of 2016 would have seen it grow to approximately USD 38,600 by the end of 2025, before brokerage fees, FX spread, and the 15% US dividend withholding tax that already applies inside the fund’s NAV (CSPX reinvests dividends net of this treaty-rate withholding, so the NAV figures above already reflect it — see our CSPX withholding tax breakdown for how that compares to a 30% rate on US-domiciled equivalents like VOO).
For a SGD-denominated comparison: at a typical exchange rate of roughly SGD 1.34 per USD, a SGD 13,400 initial outlay (≈ USD 10,000) would correspond to an ending value of roughly SGD 51,700 before FX movements over the holding period — though CSPX is USD-denominated throughout, so this SGD figure is only a reference conversion, not the fund’s actual reporting currency.
CSPX vs Its S&P 500 Benchmark: Tracking Difference
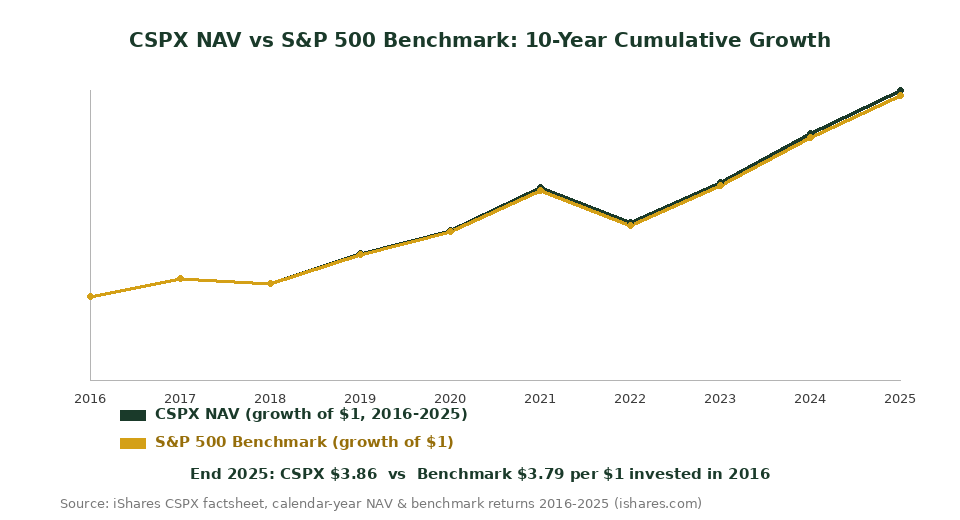
Over the same 10 years, the benchmark S&P 500 Index itself compounded to a growth factor of approximately 3.79x, or a CAGR of about 14.2% per year — roughly 0.2–0.3 percentage points per year below CSPX’s own NAV return in this particular dataset. This is a useful reminder that a UCITS ETF’s year-to-year NAV figure versus its published benchmark can show small positive or negative gaps depending on rebalancing timing, sampling, and rounding in the one-decimal-place figures funds publish — it is not evidence that the fund structurally beats its index after fees. Over any single year, expect the TER (0.07% p.a.) to be the dominant, persistent drag; cumulative multi-year “tracking difference” numbers like these should be read as directional, not as proof of outperformance.
Reading the Numbers: The 2018 and 2022 Drawdowns
Two of the ten years in this dataset were negative: 2018 (-4.7%, the trade-war correction) and 2022 (-18.3%, the Fed rate-hiking cycle that hit growth and tech valuations hardest). Both years are a useful reality check against the impression that US equities “always go up” — an investor who bought CSPX at the start of 2022 was down nearly a fifth by year-end before the 2023–2024 rebound more than made up the loss. This is the same risk pattern covered in the broader global context of our VWRA historical returns and CAGR guide, which tracks the FTSE All-World equivalent over its own rolling-return history; VWRA’s broader geographic diversification smoothed some, but not all, of the same 2022 drawdown. For Singapore investors weighing a single-country US bet (CSPX) against a global one, both articles are worth reading side by side rather than relying on a single year’s headline return.
Acknowledging limitations: this 10-year window (2016–2025) is the period iShares currently publishes on its calendar-year performance chart. It does not capture CSPX’s full since-inception history from May 2010, which included the post-2011 recovery and the 2020 pandemic crash and rebound. A longer lookback would likely show a similar CAGR in the low-to-mid teens, but investors should not extrapolate any 10-year window, however favourable, as a guarantee of future returns — the S&P 500’s long-run real (inflation-adjusted) CAGR has historically been several percentage points lower than nominal figures like these.
How to Buy CSPX in Singapore
CSPX trades on the London Stock Exchange in USD (ticker CSPX) or GBP (ticker CSP1). Singapore investors typically buy it through Interactive Brokers (IBKR), moomoo Singapore, or Longbridge Securities, all of which offer LSE market access. Open and fund a brokerage account, search for “CSPX” or ISIN IE00B5BMR087, select the London Stock Exchange venue, and place a market or limit order in USD. IBKR tends to be the most cost-effective for larger, buy-and-hold portfolios given its low per-share commission structure; moomoo and Longbridge are often simpler for beginners funding smaller, regular purchases. If you’d rather not manage LSE order placement yourself, robo-advisory platforms accessible via Syfe’s referral programme bundle similar S&P 500 exposure into a managed portfolio, at the cost of a small additional platform fee.
Who Should Use This Return Data?
This historical-return dataset is most useful if you are modelling a long-term retirement or investment plan and want a realistic, rather than optimistic, compounding assumption for US large-cap equity exposure — pair it with our retirement planning calculator to project how a CSPX-heavy portfolio might compound over your own investment horizon. It is less useful as a basis for short-term timing decisions: a 10-year calendar-year table cannot tell you whether the next 12 months will be a 2019 or a 2022. Investors uncomfortable with a single-country concentration (the S&P 500 is roughly 37% weighted to information technology per the fund’s latest sector breakdown) may prefer a globally diversified alternative, discussed in our VWRA ETF Singapore guide.
Disclaimer: This article is for educational purposes only and does not constitute financial advice. Past performance, including every figure cited above, is not indicative of future results. Singapore investors should consider their own risk tolerance, time horizon and tax position, and consult a licensed financial adviser before investing.
Frequently Asked Questions
What has CSPX's average annual return been over the last 10 years?
CSPX compounded at approximately 14.5% per year (CAGR) from the start of 2016 to the end of 2025, based on the calendar-year NAV returns published on the iShares factsheet. This includes two negative years, 2018 (-4.7%) and 2022 (-18.3%), so the path to that average was not smooth.
Is CAGR the same as the average of the yearly returns?
No. A simple arithmetic average of CSPX’s 10 annual returns (2016-2025) works out to about 15.7%, which overstates the real compounded outcome of roughly 14.5% CAGR. CAGR accounts for the sequence of gains and losses, including the fact that a large loss (like 2022’s -18.3%) needs a proportionally larger gain to fully recover.
How much would USD 10,000 in CSPX be worth today?
Based on CSPX’s calendar-year NAV returns from 2016 to 2025, a USD 10,000 investment made at the start of 2016 would have grown to approximately USD 38,600 by the end of 2025, before brokerage fees and FX conversion costs. This is a backward-looking illustration, not a forecast of future performance.
Does CSPX's return already account for US withholding tax?
Yes. As an Ireland-domiciled UCITS ETF, CSPX receives US dividends under the Ireland-US tax treaty’s 15% withholding rate rather than the 30% rate non-treaty jurisdictions face, and this tax is already deducted before the dividends are reinvested into the accumulating share class. The NAV return figures in this article are net of that 15% withholding, so Singapore investors don’t need to separately subtract it from these historical figures.
Should I compare CSPX's returns to VOO (the US-listed equivalent)?
You can compare the underlying index performance, since both track the S&P 500, but the after-tax outcome for a Singapore investor differs because of withholding tax and US estate tax exposure rather than return itself. See our dedicated CSPX withholding tax guide for the full 15% vs 30% comparison and how it affects net returns over time.
Can I buy CSPX using my CPF or SRS funds?
CSPX is not on the CPF Investment Scheme (CPFIS) approved list since it trades on the LSE rather than SGX, so CPF Ordinary or Special Account funds cannot be used directly. SRS funds can be used to buy CSPX only through a broker that explicitly supports SRS-funded overseas ETF purchases — check with your broker before assuming this is available.
Ready to Build a Long-Term ETF Portfolio?
Open a brokerage account and buy CSPX or a diversified alternative today. Use our referral links for exclusive sign-up bonuses.
This article was researched with the help of AI. While we strive to keep all information accurate and up to date, there may be errors. If you notice any discrepancies, please contact us.