CapitaLand Ascendas REIT (A17U) International Portfolio 2026: Singapore, Australia and Beyond
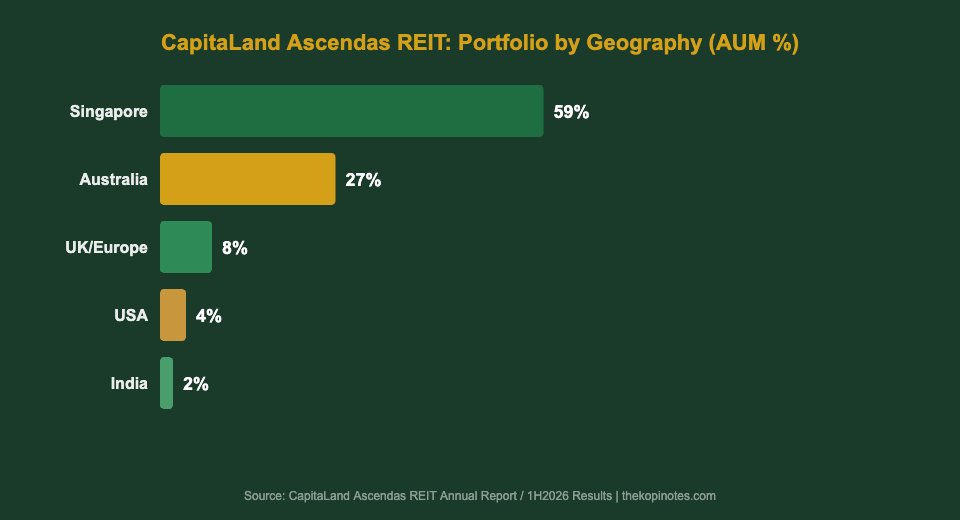
CapitaLand Ascendas REIT (SGX: A17U), known as CLAR, is Singapore’s largest industrial and logistics REIT. It owns over 220 properties spread across Singapore, Australia, the UK, the US and India. About 59% of its S$18.7 billion portfolio sits in Singapore, with Australia making up a further 27%. That geographic spread supports a distribution per unit (DPU) of roughly 15.5 cents annually — translating to a trailing yield near 6.0% at current prices.
Not financial advice. All figures are for educational reference only. Data as at September 2026 unless noted.
- CLAR owns 220+ properties across 5 countries. Singapore and Australia together account for over 85% of AUM.
- International diversification reduces single-market risk and gives exposure to Australia’s logistics boom and UK data centres.
- The trailing yield is approximately 6%, backed by a DPU track record that has held steady through two rate cycles.
In This Guide
Table of Contents
What Is CapitaLand Ascendas REIT?
CapitaLand Ascendas REIT (formerly Ascendas REIT before the 2019 CapitaLand merger) is Singapore’s first and largest business space and industrial REIT. It listed on SGX in November 2002 and has grown from a small Singapore-focused portfolio to an S$18.7 billion diversified industrial powerhouse.
CLAR’s portfolio spans five asset types: business parks and science parks, logistics and distribution centres, high-specification industrial buildings, light industrial properties, and data centres. No single tenant makes up more than 5% of its monthly gross revenue. That level of diversification is rare among Singapore-listed REITs.
As at mid-2026, CLAR has 220+ properties with a committed occupancy rate of approximately 91-93%. Its weighted average lease expiry (WALE) sits at around 3.6 years by gross revenue, which is typical for industrial REITs whose tenants sign shorter leases than office or retail occupants.
The REIT is managed by CapitaLand Ascendas REIT Management Limited, a wholly owned subsidiary of CapitaLand Investment (CLI). CLI’s backing gives CLAR a first right of refusal on assets from the CapitaLand ecosystem — a meaningful pipeline advantage for future acquisitions.
For the broader passive income landscape, see our guide on passive income Singapore options in 2026, which covers S-REITs alongside Singapore Savings Bonds and T-bills.
Singapore Portfolio: The Core Engine
Singapore accounts for roughly 59% of CLAR’s portfolio by AUM — around S$11 billion worth of assets. This remains the heartland of the REIT’s income generation.
Within Singapore, CLAR’s properties concentrate in three clusters. Business and science parks make up the largest portion, anchored by flagship assets like the International Business Park (IBP) in Jurong East and a concentration of properties along one-north in Buona Vista. These parks house major MNC tenants in banking, tech, and pharma sectors.
Logistics properties occupy the second major slice, with facilities in Tuas, Jurong, and Changi Airfreight Centre. Singapore’s role as a regional supply-chain hub underpins stable demand from 3PL operators and e-commerce distributors.
CLAR also holds data centre assets in Singapore — though these are more limited than dedicated data centre REITs like Keppel DC REIT. Its Singapore data centre exposure tends to sit within multi-tenanted, high-specification buildings shared with other industrial users.
| Geography | AUM % | No. of Properties | Key Asset Types |
|---|---|---|---|
| Singapore | ~59% | ~98 | Business parks, logistics, data centres |
| Australia | ~27% | ~62 | Logistics, data centres, business parks |
| UK / Europe | ~8% | ~30 | Data centres, logistics |
| USA | ~4% | ~26 | Business parks, life sciences |
| India | ~2% | ~7 | Business parks, IT parks |
Source: CapitaLand Ascendas REIT 1H2026 Results Presentation, August 2026 (approximate figures)
Australia Portfolio: The Logistics Growth Story
Australia is CLAR’s second-largest market at roughly 27% of AUM. The REIT entered Australia through its acquisition of Ascendas Property Fund Australasia in 2019, adding around 30 properties. It has since grown that portfolio to around 62 properties worth approximately A$5 billion.
Melbourne and Sydney account for the bulk of CLAR’s Australian assets. The key growth theme here is logistics. Australia’s e-commerce penetration has grown sharply since 2020, and demand for last-mile and big-box logistics facilities has pushed rents consistently higher. CLAR has benefited from that trend through rental reversion uplifts at lease renewals.
Australia’s data centre segment is another growth pocket. CLAR holds data centre assets in Sydney — a market where hyperscaler demand from AWS, Microsoft Azure, and Google has pushed vacancy rates to near zero. These assets generate higher yields than traditional logistics and provide natural diversification within the Australian sub-portfolio.
Currency is a key variable for Australian income. CLAR earns AUD distributions from its Australian tenants. In years where the SGD appreciates against AUD, your effective DPU share from Australia shrinks. The REIT partially hedges this with AUD-denominated borrowings, which reduces the FX translation impact on net property income but does not eliminate it entirely.
One risk worth tracking: Australian cap rates have been expanding since 2023 as the Reserve Bank of Australia raised rates. Higher cap rates compress asset values and push portfolio valuations lower. That creates downward pressure on CLAR’s NAV per unit. Management has responded by focusing on positive rental reversions to offset valuation headwinds through income growth.
UK, USA and India: The Emerging Slice
The remaining roughly 14% of CLAR’s portfolio spans three markets: the UK, the US, and India. While small individually, each adds a distinct growth angle.
United Kingdom: CLAR’s UK portfolio is primarily data centres in London and surrounding areas. The UK data centre market has seen explosive demand from AI training workloads and enterprise cloud migration. These assets carry long leases, sometimes 10-15 years, which provides income visibility well beyond most industrial properties. UK assets contribute around 8% of CLAR’s AUM.
United States: CLAR entered the US through life sciences and business park properties in San Diego and Greater San Francisco. These are two of the world’s foremost life sciences clusters. The assets are longer-duration with high-spec fit-outs for pharmaceutical and biotech tenants. US properties account for roughly 4% of AUM, and the USD income is partially natural-hedged through USD-denominated debt.
India: CLAR’s India footprint is small at around 2% of AUM — approximately seven properties concentrated in business and IT parks in Chennai and Hyderabad. India’s office market is structurally undersupplied for multinational tenants, but the assets here carry more execution risk than Singapore or Australia given regulatory complexity and currency volatility.
Together, these three markets give CLAR exposure to global technology demand — from UK and US data centres to Indian IT parks. For you as a unitholder, they contribute diversified income streams that do not move in lockstep with Singapore’s industrial cycle.
Geographic Diversification and DPU Stability
Here is the practical case for owning a geographically diversified REIT like CLAR rather than a pure-Singapore play. Different markets do not peak and trough at the same time.
When Singapore’s industrial rents softened in 2020, Australia’s logistics rents were accelerating. When US life sciences leasing slowed in 2023, Singapore’s business park demand stayed firm. That offsetting dynamic has helped CLAR maintain a relatively stable DPU through economic turbulence.
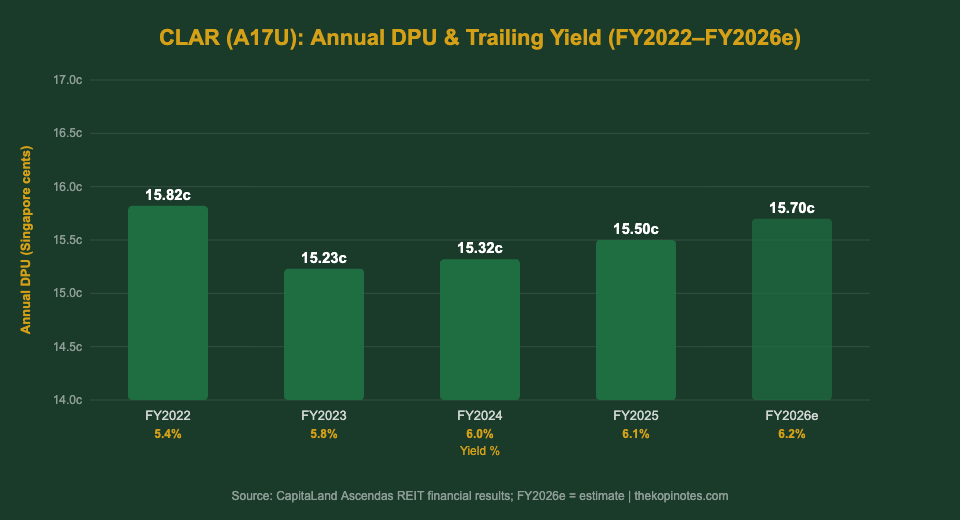
CLAR’s annual DPU has ranged from 15.23 cents to 15.82 cents since FY2022 — a narrow band despite two full rate cycles and a global slowdown. The FY2026 estimated DPU is approximately 15.70 cents, representing a trailing yield of about 6.1% at a share price of S$2.57.
That DPU stability has a cost: CLAR’s income is denominated in five currencies. SGD, AUD, GBP, USD, and INR all affect what you receive per unit. Currency moves can push your effective SGD yield up or down by 2-4% relative to the underlying asset income in a given year.
CLAR hedges a portion of its foreign income through natural currency matching (borrowing in the same currency as the asset income) and sometimes through forward contracts. The hedging ratio is disclosed in each quarterly results release under the treasury management section.
If you want to model how a 6% distribution yield could compound over your retirement horizon, the Singapore retirement calculator on TKN lets you run different reinvestment and withdrawal scenarios.
Share Price and NAV in 2026
CLAR’s share price has traded in the S$2.40 to S$2.80 range through most of 2026. As at mid-September 2026, it sits around S$2.55-2.60 — representing a discount of approximately 10-12% to its reported NAV of around S$2.85-2.90 per unit.
That NAV discount is common across the S-REIT sector right now. The September 2026 Fed rate hike pushed bond yields higher, making fixed income look more attractive relative to equity-like REIT distributions. That repricing widened the P/NAV discount across most Singapore-listed REITs.
For CLAR specifically, the NAV is also under pressure from Australian portfolio revaluations. As cap rates in Australia normalise upward from the historic lows of 2021-2022, book values on Sydney and Melbourne properties have compressed. The Singapore portfolio has held its valuations better, supported by firm industrial land rents and the government’s active management of industrial land supply through JTC.
The discount to NAV means you are buying S$1 of industrial property for roughly S$0.88-0.90 at current prices. That is not unusual for large-cap S-REITs in a rising rate environment. The question is whether the discount narrows if rates stabilise or start falling in 2027.
For a deeper look at how CLAR’s share price moved before the rate hike cycle and its 1H2026 results, see our earlier CLAR share price and DPU history guide.
How Does CLAR Compare to Peers?
CLAR is often mentioned alongside Mapletree Industrial Trust (ME8U) and Keppel DC REIT (AJBU) as the big three industrial and logistics names on SGX. Here is how they stack up on the metrics that matter most to income investors in 2026.
| REIT | Market Cap | Trailing Yield | Gearing | Geography |
|---|---|---|---|---|
| CLAR (A17U) | ~S$10.5B | ~6.0% | ~35-38% | SG/AU/UK/US/India |
| MIT (ME8U) | ~S$6.5B | ~6.2% | ~37-40% | SG/US |
| Keppel DC REIT (AJBU) | ~S$4.2B | ~5.0% | ~35-37% | SG/EU/AU/MY |
| MLT (M44U) | ~S$6.8B | ~6.3% | ~39-41% | SG/AU/MY/JP/CN/HK/VN/IN |
Source: SGX listed company data, August-September 2026. Yields based on trailing 12-month DPU and mid-September 2026 share prices. Approximate figures only.
CLAR sits in the middle of the pack on yield at around 6.0%. It is more expensive (lower yield) than MLT or MIT, but that premium reflects its position as the largest, most liquid S-REIT with a broader geographic and sector spread. For some investors, the liquidity and name recognition justify the marginal yield gap.
If you want to explore a basket approach rather than picking individual names, the Singapore REIT ETF guide covers how to access diversified S-REIT exposure through a single fund on SGX.
For building an S-REIT portfolio with a robo-advisor, platforms like Syfe (referral code: SRPRFFFCD) and Endowus (referral code: 2V343) offer managed S-REIT portfolios for investors who prefer not to pick stocks themselves. Both have low minimums and are CPF-investable.
For context on which S-REITs have been highlighted in 2026, the best S-REITs in Singapore 2026 guide compares yield, gearing, and growth outlook across the top names.
Frequently Asked Questions
How many countries does CapitaLand Ascendas REIT invest in?
What is CLAR's current yield in 2026?
Is CLAR suitable for CPF investing?
How does CLAR manage foreign currency risk?
What is CLAR's gearing ratio and why does it matter?
How is CLAR different from Mapletree Industrial Trust?
Not financial advice. All data is for educational purposes only. Verify all figures directly with CapitaLand Ascendas REIT’s official results and SGX filings before making any investment decision. Past distributions are not a guarantee of future payouts.
This article was researched with the help of AI. While we strive to keep all information accurate and up to date, there may be errors. If you notice any discrepancies, please contact us.