Mapletree Industrial Trust Share Price 2026 (ME8U): 2H2026 DPU Outlook, Valuation & Investor Verdict
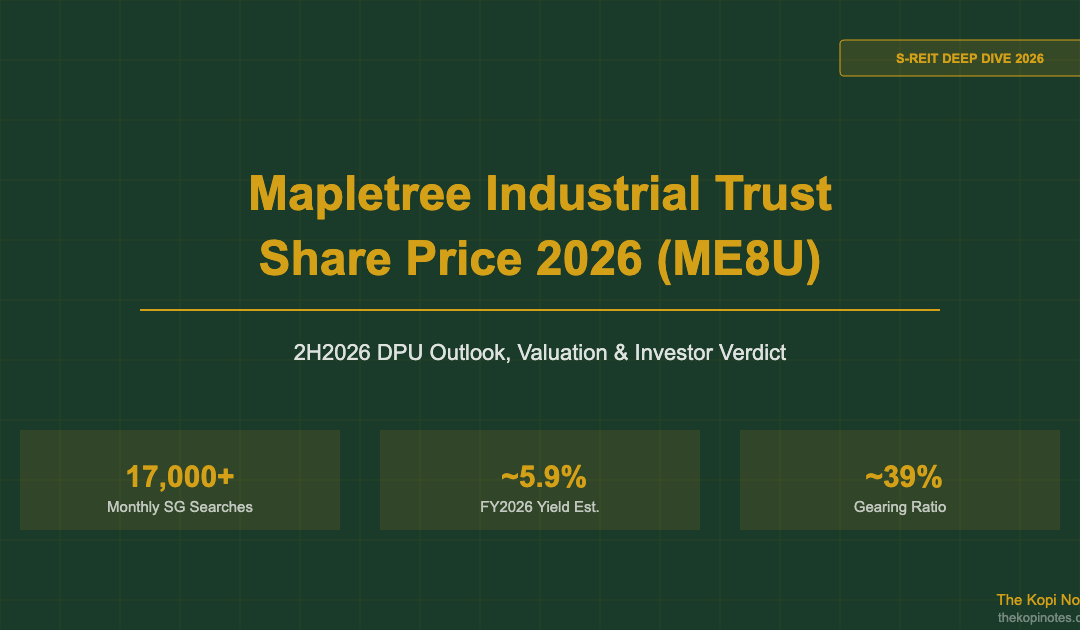
Mapletree Industrial Trust (SGX: ME8U) is one of Singapore’s largest and most diversified industrial REITs, with a portfolio spanning flatted factories, hi-tech buildings, and data centres across Singapore and the United States. As at October 2026, MIT offers an estimated distribution yield of approximately 5.9% per annum with a stable 1HFY2026/27 DPU expected in November 2026 — making it a key consideration for Singapore income investors seeking data centre exposure within a defensive REIT structure.
Not financial advice. All figures are for educational reference only. Data as at October 2026 unless noted.
Table of Contents
Contents
- MIT at a Glance: Key Stats for 2026
- MIT Share Price Performance 2026
- 2H2026 DPU Outlook & Distribution Calendar
- MIT Portfolio: Data Centres, Hi-Tech & Flatted Factories
- Valuation & NAV Analysis
- MIT vs Industrial REIT Peers
- Key Risks to Watch
- Investor Verdict: Is MIT a Buy in 2H2026?
- Frequently Asked Questions
MIT at a Glance: Key Stats for 2026
Mapletree Industrial Trust was listed on the SGX in October 2010 and has grown from a pure Singapore industrial REIT into a diversified data centre-anchored portfolio spanning two continents. Managed by Mapletree Industrial Trust Management Ltd (a Mapletree Investments subsidiary), MIT benefits from a strong institutional sponsor with access to a deep pipeline of industrial and data centre assets.
| Metric | Value (Oct 2026) |
|---|---|
| SGX Ticker | ME8U |
| Share Price (Est.) | SGD ~2.28 |
| NAV Per Unit (Est.) | SGD ~2.42 |
| P/NAV | ~0.94x (below book value) |
| Estimated Distribution Yield | ~5.9% p.a. |
| Gearing Ratio | ~39% |
| Portfolio Occupancy | ~93.5% |
| Number of Properties | ~144 (SG + USA) |
| Total AUM | ~SGD 9.0 billion |
| Financial Year End | 31 March (FY2026/27 = Apr 2026–Mar 2027) |
| Distribution Frequency | Quarterly |
Source: MIT investor relations, SGX filings, TKN estimates as at October 2026. Not investment advice.
MIT Share Price Performance 2026
Mapletree Industrial Trust’s share price has shown resilience in 2026, supported by strong data centre demand and the prospect of US Federal Reserve rate cuts. After a challenging 2023–2024 period when rising interest rates pressured REIT valuations, MIT’s share price began recovering in 2025 as the rate cycle turned.
As at October 2026, MIT trades at approximately SGD 2.28, representing a discount to its estimated NAV of SGD 2.42 — or approximately 0.94x P/NAV. This discount reflects residual market caution around interest rate sensitivity and the US-China tech rivalry’s potential impact on data centre tenants, rather than fundamental weakness in MIT’s business.
Key share price catalysts to watch for the remainder of 2026:
- 1HFY2026/27 Results Announcement (expected Nov 2026): MIT’s 1H results will confirm whether DPU has been maintained or modestly grown versus 1HFY2025/26.
- Fed Rate Path: Each 25 bps rate cut reduces MIT’s borrowing costs and improves DPU headroom. With ~39% gearing and ~SGD 3.5 billion in debt, a 50 bps cut could add roughly SGD 0.2–0.3 cents to annual DPU.
- US Data Centre Occupancy: MIT’s US portfolio (~47% of AUM) comprises 29 data centres across 14 US states. Sustained hyperscaler demand (AWS, Google, Microsoft) keeps occupancy high and supports rental reversions.
- SGD/USD exchange rate: US income is hedged in part, but a stronger SGD reduces the translated DPU contribution from the US portfolio.
For context on how MIT compares with the broader S-REIT market’s recovery in 2026, see our guide to passive income Singapore strategies and best S-REITs in Singapore 2026.
2H2026 DPU Outlook & Distribution Calendar
MIT distributes quarterly, with payment dates typically in March, June, September, and December. For FY2026/27 (April 2026 – March 2027), the two key distribution periods are:
- 1HFY2026/27 (Apr–Sep 2026): Results expected November 2026, payment in December 2026
- 2HFY2026/27 (Oct 2026–Mar 2027): Results expected May 2027, payment in June 2027
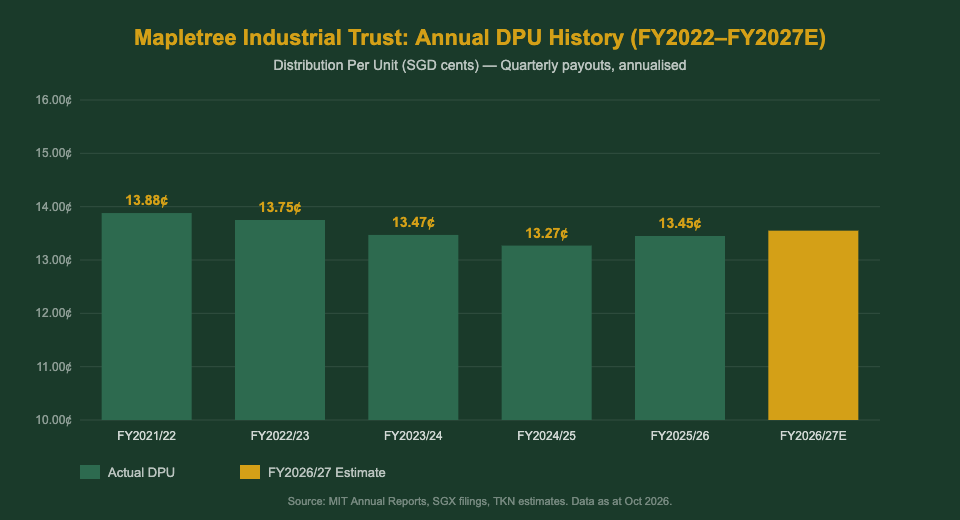
TKN estimates MIT’s FY2026/27 total DPU at approximately 13.55 Singapore cents per unit, marginally above FY2025/26’s ~13.45 cents. This modest growth is supported by:
- Positive rental reversions in Singapore hi-tech buildings and flatted factories (~3–8% uplift on renewed leases)
- Full-year contribution from data centres in the US acquired in prior years
- Lower weighted average cost of debt if the Fed delivers 2–3 rate cuts in 2026/27
- Stable occupancy above 93% across the Singapore portfolio
At a share price of SGD 2.28 and estimated annualised DPU of 13.55 cents, the forward yield works out to approximately 5.9%. For Singapore investors using Syfe referral code to invest in REIT ETFs, or buying MIT directly through Endowus referral code for CPF/SRS investing, this yield is tax-exempt in Singapore (no dividend withholding tax for S-REIT distributions to Singapore resident individuals).
It’s worth noting that MIT’s DPU has shown a slight declining trend from its peak of ~13.88 cents in FY2021/22, primarily due to higher interest costs from rising rates and the dilutive effect of equity fundraising for US data centre acquisitions. As rates ease in 2026/27, this trend should stabilise and potentially reverse.
MIT Portfolio: Data Centres, Hi-Tech & Flatted Factories
What sets MIT apart from a pure-play industrial REIT is its deliberate pivot toward data centres. Since acquiring its first US data centres in 2020 via Mapletree Industrial Trust Management’s JV with Mapletree Investments, MIT has transformed roughly 47% of its AUM into data centre assets — making it more akin to a hybrid data centre and industrial trust.
Here is MIT’s portfolio breakdown by asset type as at mid-FY2026/27:
| Asset Type | % of AUM | Key Markets | Occupancy |
|---|---|---|---|
| Data Centres (US) | ~47% | 29 properties, 14 US states | ~99% |
| Hi-Tech Buildings (SG) | ~19% | Alexandra Technopark, Telok Blangah, etc. | ~93% |
| Data Centres (SG) | ~14% | 1 Tuas South, 26A Ayer Rajah Crescent | ~100% |
| Flatted Factories (SG) | ~14% | Various JTC estates across Singapore | ~89% |
| Stack-Up / Ramp-Up (SG) | ~6% | Light industrial clusters | ~91% |
Source: MIT Investor Presentation 1HFY2026/27, SGX filings. Percentages are approximate. Data as at October 2026.
The US data centre portfolio stands out for its near-100% occupancy, driven by long-term leases with hyperscalers and tech companies averaging weighted average lease expiry (WALE) of over 5 years. This provides income visibility and insulates MIT from short-term occupancy fluctuations affecting the Singapore industrial segment.
Singapore flatted factories face the most headwinds — JTC land lease renewals at higher premiums and some tenant churn as lighter manufacturers relocate to Malaysia or Vietnam. However, MIT has been proactively upgrading flatted factory clusters to hi-tech specifications to capture higher-value tenants.
Valuation & NAV Analysis
MIT is currently trading at approximately 0.94x P/NAV — a modest discount to book value. Historically, MIT has traded at a premium to NAV (1.1x–1.3x) during low-rate environments, reflecting the market’s willingness to pay up for data centre exposure and income growth.
The current discount presents a case for value entry, provided investors accept the following:
- Interest rate trajectory: If rates stay higher for longer or the Fed pauses cuts, MIT’s borrowing costs will remain elevated, capping DPU growth potential.
- US data centre revaluation risk: Cap rate expansion in the US property market (driven by local REIT valuations) could compress MIT’s US data centre NAV.
- Currency risk: US dollar-denominated income (~47% of NPI) hedged in part but not fully — SGD strength reduces translated distributions.
For investors who bought MIT using their CPF Ordinary Account via CPF investment strategy rules, or using SRS funds through platforms like FSMOne referral code, MIT qualifies for both investment channels — making the tax-exempt distribution even more attractive on an after-tax basis.
To put MIT’s valuation in context: a Singapore investor with SGD 50,000 in MIT at SGD 2.28 per unit would hold approximately 21,929 units. At the estimated FY2026/27 DPU of 13.55 cents, this generates roughly SGD 2,971 in annual distributions — paid quarterly at around SGD 743 per quarter.
MIT vs Industrial REIT Peers
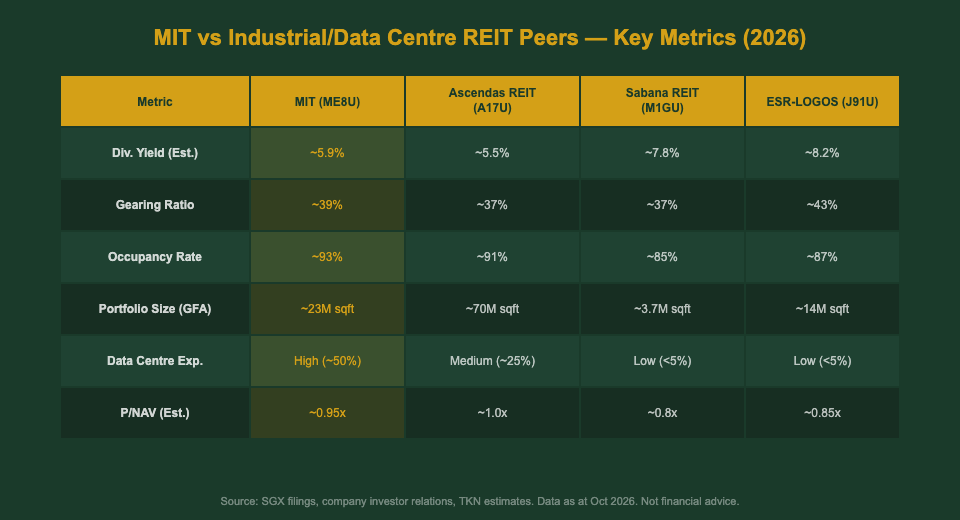
How does MIT compare against other industrial-focused S-REITs? The chart above summarises key metrics as at October 2026. Key observations:
- Yield vs Risk: MIT’s ~5.9% yield is lower than Sabana REIT (~7.8%) and ESR-LOGOS (~8.2%), but those higher yields reflect greater risk — smaller portfolio scale, higher concentration risk, and less stable income streams.
- Data Centre Premium: MIT commands a lower yield than pure industrial peers because of its data centre exposure, which the market prices as a growth asset rather than a pure yield play.
- CapitaLand Ascendas REIT (A17U): MIT’s closest peer in terms of scale and diversification, though Ascendas has a smaller data centre allocation and broader industrial exposure across Asia-Pacific. For a full review see our article on passive income Singapore.
- Gearing: MIT’s ~39% gearing is within MAS’s 50% cap and leaves room for debt-funded acquisitions, but is slightly elevated versus peers like Ascendas (~37%).
For investors seeking a REIT that bridges the gap between industrial income and tech/data centre growth, MIT remains one of the most compelling options on the SGX. If you’re building a diversified REIT portfolio, the Singapore REIT ETF guide shows how to gain broad S-REIT exposure alongside targeted single-REIT holdings like MIT.
Key Risks to Watch
No S-REIT is without risk, and MIT is no exception. Here are the four material risks for the 2H2026 period:
1. Interest Rate Sensitivity
MIT carries ~SGD 3.5 billion in debt. With ~50% on fixed-rate terms and ~50% on floating rates (estimated), each 25 bps rise in SORA or US SOFR adds approximately SGD 4–5 million in annual interest expense, shaving ~0.1–0.15 cents off DPU. The flipside: rate cuts in 2026 could meaningfully boost DPU.
2. US-China Tech Tensions & AI Semiconductor Restrictions
MIT’s US data centres serve some China-linked tech tenants and AI infrastructure companies. Export controls on AI chips (NVIDIA, AMD GPUs) imposed by the US government could slow data centre buildout by certain tenants, affecting renewal demand. This is a tail risk rather than a near-term threat.
3. JTC Land Lease Renewals
Singapore flatted factories sit on JTC-leased land. Upon lease expiry, JTC may not renew or may renew at significantly higher rates. MIT’s lease expiry schedule is manageable through FY2028, but longer-term, this remains a structural overhang.
4. Equity Fundraising Dilution
MIT has historically grown by acquiring US data centres via preferential offerings and private placements. Each new placement dilutes existing unitholders unless the acquired yield is accretive. Monitor MIT’s pipeline announcements carefully before large acquisitions.
For broader market context, check our Singapore retirement calculator to model how MIT’s distributions contribute to your long-term retirement income plan.
Investor Verdict: Is MIT a Buy in 2H2026?
Mapletree Industrial Trust is a HOLD to BUY for Singapore income investors in 2H2026, with the buy case strengthening as rate cuts materialise.
Here is a simple framework:
- BUY if: You want data centre exposure within a Singapore tax-efficient REIT wrapper, accept a ~5.9% yield, and believe the Fed will deliver ≥2 rate cuts in 2026/27 that reduce MIT’s borrowing costs.
- HOLD if: You already own MIT and are comfortable with the current yield; wait for 1HFY2026/27 results (Nov 2026) to confirm DPU before adding.
- AVOID if: You need yield above 6.5% or are uncomfortable with USD currency exposure and US real estate risk.
For investors building a diversified passive income portfolio, MIT pairs well with retail REITs (e.g., Frasers Centrepoint Trust for SGD retail income), healthcare REITs (e.g., ParkwayLife REIT), and a broad S-REIT ETF via platforms offering the Syfe referral code SRPRFFFCD or Endowus referral code 2V343.
This is not financial advice. Always conduct your own due diligence before investing. Past distributions are not a guarantee of future distributions.
Frequently Asked Questions
What is Mapletree Industrial Trust (ME8U) share price today?
As at October 2026, Mapletree Industrial Trust (SGX: ME8U) trades at approximately SGD 2.28 per unit, a modest discount to its estimated NAV of SGD 2.42. The share price has been supported by strong data centre demand and improving rate outlook, but remains below its 2021 peak above SGD 3.00. Always check the SGX or your broker platform for the latest live price before transacting.
What is MIT REIT's dividend yield in 2026?
Based on TKN’s estimate of FY2026/27 DPU of approximately 13.55 Singapore cents per unit and a share price of SGD 2.28, MIT’s forward distribution yield is approximately 5.9% per annum as at October 2026. MIT distributes quarterly, with payments typically in March, June, September, and December. All S-REIT distributions are tax-exempt for Singapore resident individuals, making the effective yield competitive.
Is Mapletree Industrial Trust a data centre REIT?
Yes, to a significant degree. As at 2026, approximately 47% of MIT’s AUM consists of US data centres and a further 14% of AUM is Singapore data centres — meaning over 60% of MIT’s portfolio value is in data centre assets. MIT also holds hi-tech buildings, flatted factories, and stack-up/ramp-up properties in Singapore, making it a hybrid data centre and industrial trust rather than a pure industrial REIT.
Can I buy Mapletree Industrial Trust with CPF or SRS?
Yes. MIT is an SGX-listed S-REIT and qualifies for both CPF Investment Scheme (CPFIS-OA) and Supplementary Retirement Scheme (SRS) investment. You can buy MIT directly through a brokerage linked to your CPF or SRS account, or invest in S-REIT ETFs that include MIT via platforms like FSMOne or Endowus. The advantage: S-REIT distributions are tax-exempt, so your quarterly DPU accumulates more efficiently within tax-advantaged accounts.
What is MIT's gearing ratio and is it safe?
MIT’s gearing ratio is approximately 39% as at October 2026, well within the MAS regulatory cap of 50% for Singapore-listed REITs. At 39%, MIT has headroom to take on additional debt for acquisitions. However, as gearing approaches 40%, investors should monitor refinancing costs and the impact of interest rate movements on DPU. MIT’s management has been proactive in locking in fixed-rate borrowings and staggering debt maturity dates to manage refinancing risk.
How does MIT compare with CapitaLand Ascendas REIT?
Both are large Singapore industrial REITs with data centre exposure, but they differ in key ways. CapitaLand Ascendas REIT (A17U) is larger by AUM (~SGD 17 billion vs MIT’s ~SGD 9 billion), more geographically diversified (Australia, UK, US, Singapore, India), and has a broader industrial tenant mix. MIT has a higher concentration in US data centres (~47% of AUM) versus Ascendas (~25%). MIT typically offers a slightly higher yield (~5.9% vs ~5.5%) reflecting its higher US concentration risk. Both are considered blue-chip S-REITs suitable for long-term income portfolios.
This article was researched with the help of AI. While we strive to keep all information accurate and up to date, there may be errors. If you notice any discrepancies, please contact us.