Frasers Centrepoint Trust White Sands Sale: How the S$467M Divestment Cuts Leverage to 36.5% (SGX: J69U)
Frasers Centrepoint Trust (FCT) is selling White Sands mall for S$467 million, an 8.4% premium to its last valuation. The sale will cut FCT’s aggregate leverage from 40.4% to a pro forma 36.5%, giving you a REIT with a stronger balance sheet, more debt headroom, and dry powder for future acquisitions.
Not financial advice. All figures are for educational reference only. Data as at August 2026 unless noted.
- FCT is divesting White Sands for S$467M — leverage falls from 40.4% to ~36.5% once the deal completes.
- 1HFY26 net property income (NPI) grew 20.2% and DPU rose 1.4% to 6.136 cents, backed by acquisitions and 6.5% rental reversions.
- The freed-up balance sheet capacity sets FCT up to bid for more malls — including its 50% stake in the Bayshore Drive integrated site.
Table of Contents
What Happened: The White Sands Divestment
3QFY26 Business Update Snapshot
Leverage & Balance Sheet Impact
What This Means for Your DPU
The Bayshore Drive Wildcard
Risks to Watch
FAQ
What Happened: The White Sands Divestment
On 30 June 2026, FCT announced it’s selling White Sands, a suburban mall in Pasir Ris, for S$467 million. That’s an 8.4% premium over the property’s last book valuation.
This isn’t a fire sale. It’s what REIT managers call “capital recycling” — selling a mature, slower-growth asset at a good price, then redeploying the cash into debt reduction or new acquisitions with better growth potential.
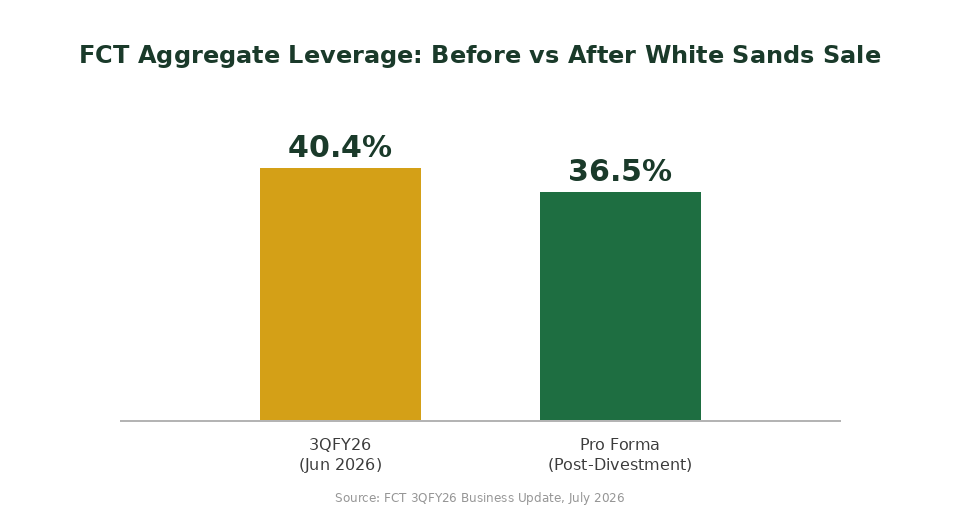
For you as a unitholder, the immediate effect is balance sheet strength. FCT’s aggregate leverage (the ratio of total debt to total assets) drops from 40.4% as at 30 June 2026 to a pro forma 36.5% once the sale completes.
Here’s why that premium matters: it shows retail mall valuations in Singapore’s suburban belt are holding up, even as some office and hospitality assets have seen valuation pressure elsewhere in the region.
You can read the full announcement on FCT’s investor relations site, which discloses all SGX filings related to the divestment.
3QFY26 Business Update Snapshot
FCT released its 3QFY26 business update alongside news of the divestment. The headline numbers tell a story of steady, unspectacular strength — exactly what you want from a suburban retail REIT.
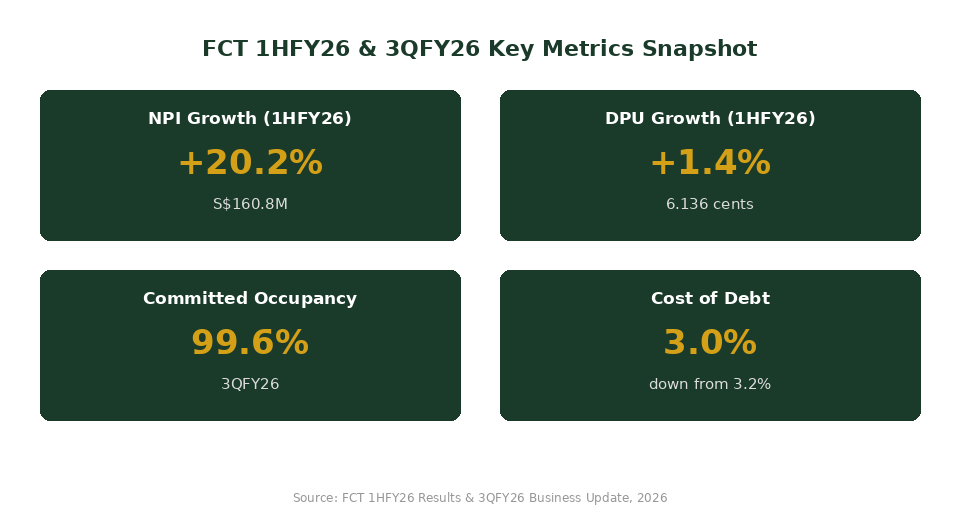
Committed occupancy across the portfolio stood at 99.6% as at 30 June 2026. That’s about as close to full as a shopping mall REIT gets. Shopper traffic was up 2.0% year-on-year, and tenant sales rose 1.8% over the same period.
However, cost of debt fell to 3.0% in 3QFY26, down from 3.2% the previous quarter. FCT also holds S$861.1 million in undrawn credit facilities — that’s dry powder it can tap without needing to raise fresh equity.
Management is guiding for full-year positive rental reversions of around +5%. For context, 1HFY26 rental reversion already came in at a healthy +6.5% on an average-to-average basis.
Leverage & Balance Sheet Impact
Here’s the before-and-after picture on FCT’s balance sheet:
| Metric | Before (3QFY26) | After White Sands Sale |
|---|---|---|
| Aggregate Leverage | 40.4% | ~36.5% |
| Cost of Debt | 3.0% | Expected to stay stable or improve |
| Undrawn Facilities | S$861.1 million | Higher post-repayment headroom |
| Divestment Premium | — | +8.4% above valuation |
Source: FCT 3QFY26 Business Update, July 2026
A lower leverage ratio means FCT has more room to borrow before hitting MAS’s regulatory ceiling of 50% for S-REITs. Practically, this gives management flexibility — it can fund the next acquisition with debt instead of issuing new units, which would dilute your existing holding.
You can check how a REIT’s leverage and interest coverage ratio (ICR) stack up using TKN’s S-REIT Gearing Ratio & ICR Calculator — useful when comparing FCT against other best S-REITs in Singapore 2026.
What This Means for Your DPU
Distribution Per Unit (DPU) — basically how much cash each FCT unit pays you — grew 1.4% year-on-year to 6.136 cents in 1HFY26. That’s a modest but positive number, especially given FCT also raised new units during the period.
Net property income (NPI) grew faster, up 20.2% to S$160.8 million in 1HFY26. However, DPU growth lagged NPI growth. That’s a familiar pattern in the S-REIT sector this year — acquisitions boost income, but the associated equity fundraising increases the unit count, so per-unit growth ends up smaller than headline income growth.
| Metric | 1HFY26 | YoY Change |
|---|---|---|
| Net Property Income (NPI) | S$160.8 million | +20.2% |
| DPU | 6.136 cents | +1.4% |
| Rental Reversion (avg-to-avg) | +6.5% | Healthy vs. FY guidance of +5% |
| Committed Occupancy | 99.6% | Near-full |
Source: FCT 1HFY26 Results & 3QFY26 Business Update, 2026
In practice, this means you shouldn’t expect a dramatic DPU jump from the White Sands sale itself. Divestments usually cause a short-term dip in distributable income (you lose the rent from the sold mall) before the redeployed capital starts earning again. The upside is a safer, more efficient balance sheet — which matters more for a REIT’s long-term unit price than one quarter’s DPU print.
The Bayshore Drive Wildcard
Here’s why the timing of this divestment is interesting. On 15 July 2026, a consortium of Frasers Property, FCT, Sunway MCL, Sekisui House and Lum Chang emerged as the top bidder for the Bayshore Drive integrated site — a large government land sale (GLS) plot combining residential and retail components.
FCT holds a stake in the retail component of this consortium. That said, this is a long-dated project — completion isn’t expected until around end-2030. The freed-up balance sheet capacity from the White Sands sale gives FCT room to fund its share of this development without straining leverage further.
For example, if FCT’s share of the Bayshore retail component costs several hundred million dollars, having leverage at 36.5% instead of 40.4% gives management meaningfully more breathing room to fund it with debt rather than another dilutive equity raise.
Risks to Watch
No REIT is without risk, and FCT is no exception. A few things worth watching:
First, losing White Sands’ rental income creates a short-term income gap until the sale proceeds are redeployed. If redeployment is delayed, DPU could see a temporary dip.
Second, suburban retail is sensitive to consumer spending. If Singapore’s economy slows or shopper traffic softens, occupancy and rental reversions could come under pressure — though FCT’s 99.6% occupancy suggests limited near-term risk.
Third, the Bayshore Drive project is years away from completion. Development risk (construction costs, delays, market conditions in 2030) is real, even if it’s not an immediate concern.
According to FCT’s own investor relations disclosures, management remains focused on disciplined capital recycling rather than growth at any cost — a reassuring signal for income-focused investors.
For independent broker commentary on this update, see Minichart’s 3QFY26 business update summary.
If you’re building a diversified income portfolio around Singapore REITs, it’s worth reading FCT’s FCT share price target and analyst verdicts alongside this update, and checking how REIT income compares with other passive income Singapore strategies. You can also model your own retirement income mix using TKN’s Singapore retirement calculator.
If you’re looking to start or grow a brokerage portfolio to hold S-REITs like FCT, you can compare platforms using the Syfe referral code and sign-up bonus — Syfe supports both REITs and diversified ETF portfolios in one account.
Frequently Asked Questions
Why is Frasers Centrepoint Trust selling White Sands?
How much will FCT's leverage fall after the sale?
Will the White Sands sale increase FCT's DPU?
What was FCT's occupancy and rental reversion in 3QFY26?
What is FCT's involvement in the Bayshore Drive project?
What is FCT's cost of debt in 2026?
Is Frasers Centrepoint Trust a good REIT for passive income?
This article was researched with the help of AI. While we strive to keep all information accurate and up to date, there may be errors. If you notice any discrepancies, please contact us.