CapitaLand Ascendas REIT (A17U) Gearing & Debt Management 2026: Q4 Rate Cuts Change the Math
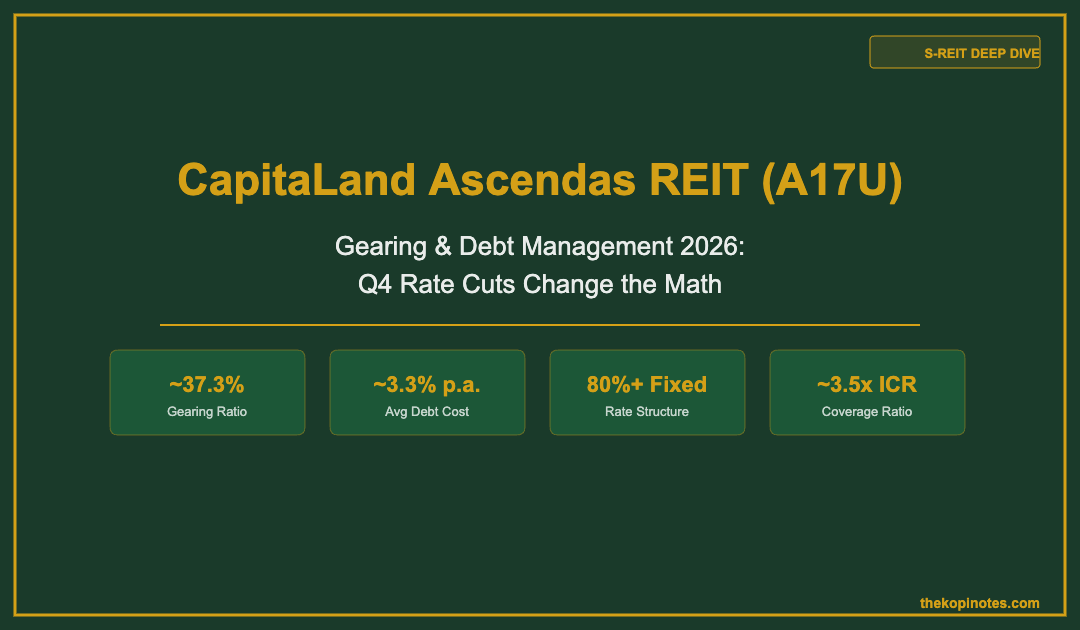
CapitaLand Ascendas REIT (A17U) carries a gearing ratio of approximately 37.3% as at 1H FY2026. That sits comfortably within MAS’s 45% regulatory cap — and the REIT holds an investment-grade credit rating that gives it access to a 50% ceiling if needed. Its weighted average cost of debt is around 3.3% per annum, with approximately 82% of borrowings at fixed rates. For investors tracking the CLAR share price, Q4 2026 rate cuts directly reduce this cost burden and lift distributable income.
Not financial advice. All figures are approximate, for educational reference only, and sourced from CapitaLand Ascendas REIT’s publicly available 1H FY2026 financial results. Verify all data with official CLAR disclosures before making any investment decision.
Table of Contents
What Is Gearing and Why It Matters for REIT Investors
Gearing measures how much of a REIT’s assets are financed by debt. The formula is simple: total debt divided by total assets. MAS caps Singapore REITs at 45% — or 50% for REITs with an investment-grade credit rating.
A lower gearing ratio means less financial risk. It also means more borrowing capacity to fund acquisitions when opportunities arise. A higher ratio means higher interest payments eat into distributions — and the REIT has less room to absorb a property valuation drop before breaching its covenant.
For industrial and logistics REITs like CLAR, gearing matters more than for retail peers because property valuations are more sensitive to cap rate movements. When cap rates widen — as they do during rate hike cycles — asset values fall and gearing rises mechanically, even without new borrowing.
Understanding CLAR’s gearing is one piece of the analysis. If you want a broader picture of which best S-REITs in Singapore 2026 offer the strongest risk-adjusted yield, the full comparison covers ten REITs across sectors.
CLAR Gearing Ratio — 2026 Numbers vs Peers
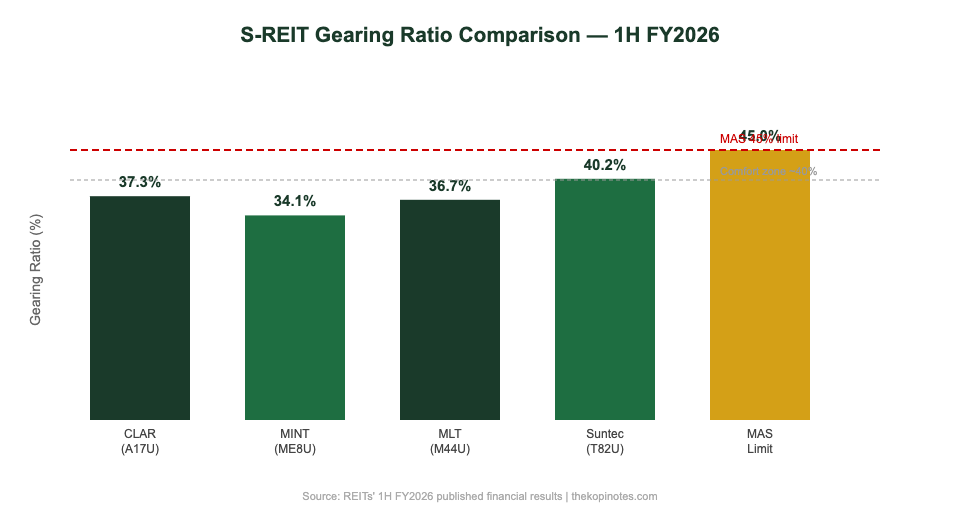
CLAR’s gearing sits at approximately 37.3% as at 1H FY2026. That is below the 40% level that most institutional investors treat as a caution threshold, and well inside MAS’s hard cap. With a Moody’s A3 credit rating, CLAR technically has access to the 50% ceiling — but management has consistently guided a target range of 35–40%.
The table below places CLAR in context with three comparable Singapore industrial and commercial REITs. All figures are approximate and sourced from each REIT’s 1H FY2026 published results.
| REIT | Gearing | Avg Debt Cost | Fixed Rate | ICR |
|---|---|---|---|---|
| CLAR (A17U) | ~37.3% | ~3.3% p.a. | ~82% | ~3.5x |
| MINT (ME8U) | ~34.1% | ~3.1% p.a. | ~80% | ~4.0x |
| MLT (M44U) | ~36.7% | ~3.2% p.a. | ~79% | ~3.6x |
| Suntec REIT (T82U) | ~40.2% | ~3.5% p.a. | ~74% | ~2.9x |
| MAS Regulatory Cap | 45% (50%*) | — | — | Min 2.5x |
*50% cap applies to REITs with a minimum investment-grade credit rating. Figures are approximate based on 1H FY2026 published results. Source: Individual REIT financial disclosures, 2026.
CLAR compares well. Its gearing is lower than Suntec’s and roughly in line with MLT’s. MINT runs the leanest balance sheet of this peer group, partly because its data centre assets command higher valuations. For a deeper dive into CLAR’s portfolio mix and occupancy, see the analysis of CapitaLand Ascendas REIT occupancy rates and tenant quality in 2026.
Weighted Average Debt Cost and the Fixed Rate Shield
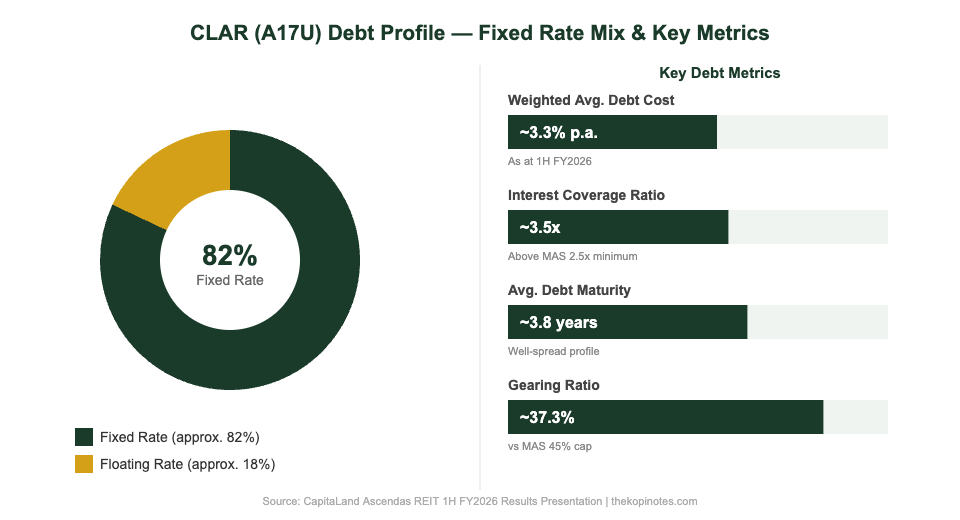
CLAR’s weighted average all-in cost of debt is approximately 3.3% per annum as at 1H FY2026. That is the blended rate across all its borrowings — Singapore dollars, US dollars, Australian dollars and British pounds — after accounting for interest rate swaps and hedging instruments.
Around 82% of CLAR’s debt is at fixed rates. This is deliberate. Management locks in rates on a rolling basis to reduce DPU volatility. When the Fed hiked aggressively in 2022–2023, CLAR’s distributions held steadier than REITs with higher floating-rate exposure precisely because of this hedging programme.
The 18% floating-rate portion is the slice most sensitive to rate movements. With the Fed cutting rates in Q4 2026, this slice gets cheaper. On a total debt base of approximately S$7.2 billion, each 25-basis-point cut reduces annual interest expense by roughly S$3–4 million on the floating portion — a modest but real boost to distributable income.
For a parallel analysis on how MLT manages the same balance sheet challenge, the Mapletree Logistics Trust gearing and debt maturity 2026 article covers MLT’s approach in detail.
CLAR Debt Maturity Profile — No Near-Term Cliff
A debt maturity wall is when a large proportion of borrowings fall due at the same time, forcing a REIT to refinance in potentially unfavourable conditions. CLAR actively manages this risk by spreading maturities across multiple years.
The approximate debt maturity profile as at 1H FY2026 is shown below. CLAR does not publish an exact year-by-year breakdown in its investor presentations, so the figures below are indicative of the general spread.
| Maturity Window | Approx. % of Total Debt | Notes |
|---|---|---|
| Within 1 year (by end 2026) | ~5–8% | Low near-term refinancing pressure |
| 1–2 years (2027) | ~12–16% | Manageable; likely to refinance at lower rates |
| 2–3 years (2028) | ~16–20% | Core refinancing window |
| 3–5 years (2029–2030) | ~25–30% | Well-spread across years |
| Beyond 5 years (2031+) | ~30–40% | Long-dated bonds; lower refinancing risk |
Figures are indicative based on CLAR’s average debt maturity of approximately 3.8 years as at 1H FY2026. Verify the precise maturity schedule in CLAR’s latest supplementary data package on the SGX website.
An average maturity of around 3.8 years is healthy for a large industrial REIT. It means CLAR is not under pressure to refinance at any single point. Debt maturing in 2027–2028 will almost certainly be rolled over at lower rates if the Q4 2026 rate-cut cycle continues, which is directly accretive to distributable income.
Building passive income in Singapore through REITs depends heavily on the stability of these distributions. Understanding debt management is one of the more underrated inputs in that assessment.
Interest Coverage Ratio — How Much Buffer Does CLAR Have?
The interest coverage ratio (ICR) tells you how many times a REIT’s net property income covers its interest expense. MAS requires a minimum ICR of 2.5x. Below 2.5x, a REIT cannot take on new debt and faces operational restrictions.
CLAR’s ICR sits at approximately 3.5x as at 1H FY2026. That is 40% above the MAS floor. It is not the highest in the peer group — MINT runs at around 4.0x — but it is materially above the danger zone.
An ICR of 3.5x provides meaningful buffer against two scenarios that REIT investors should stress-test:
Scenario 1 — Net property income falls 10%: ICR drops to approximately 3.2x. Still comfortably above 2.5x. CLAR continues operating without restrictions.
Scenario 2 — Interest rates spike 150bps on the floating portion: Annual interest expense rises by roughly S$19–20 million (assuming ~S$1.3 billion floating exposure). ICR falls to approximately 3.2x. Again, safe.
The combination of moderate gearing, high fixed-rate hedging, and a 3.5x ICR makes CLAR’s balance sheet one of the more resilient in the Singapore industrial REIT space.
How Q4 2026 Rate Cuts Change the Math for CLAR
Rate cuts affect CLAR through three channels. Each operates on a different timeline.
Channel 1 — Direct reduction in floating-rate debt cost. With approximately 18% of debt at floating rates (roughly S$1.3 billion), a 50-basis-point cut in the reference rate saves CLAR around S$6.5 million annually. Spread over approximately 2.9 billion units on issue, that adds roughly 0.2 cents per unit per year to distributable income — modest, but real.
Channel 2 — Refinancing at lower fixed rates. Debt maturing in 2027 and 2028 was likely locked in at 2022–2023 peak rates. Refinancing that tranche at 2026–2027 rates represents a more significant saving. A 1-percentage-point reduction in the cost of S$1.5 billion of maturing debt saves S$15 million annually — equivalent to about 0.5 cents per unit.
Channel 3 — Cap rate compression and asset value uplift. Lower rates reduce the discount rate applied to REIT valuations. As cap rates compress, industrial property values rise, gearing falls mechanically, and CLAR gains additional debt headroom for acquisitions. This is the slowest channel to play out, but it is the most impactful for share price appreciation.
Together, these three channels explain why CLAR’s A17U share price typically re-rates alongside falling rate expectations — even before distributions actually increase.
If you are thinking through how REIT distributions fit into a longer-term income plan, the Singapore retirement calculator can help you model different yield and drawdown scenarios.
What This Means for the CapitaLand Ascendas REIT Share Price
The A17U share price has tracked the rate-cut narrative closely in 2026. The market is forward-looking: it prices in distribution growth before the numbers arrive in the accounts.
On a forward DPU basis, CLAR yields approximately 5.0–5.5% at the S$2.75 range (as at the time of writing, September 2026). That yield compresses as the share price rises with rate-cut expectations. But a 5% yield on a Moody’s A3-rated REIT with 37% gearing and 3.5x ICR is not stretched by historical standards.
Three risks worth holding alongside the rate-cut thesis:
Risk 1 — Tenant demand softness. CLAR’s Singapore logistics and business park segments depend on demand from tech, pharma and manufacturing tenants. A regional economic slowdown would slow leasing velocity and cap rental reversion, even in a low-rate environment.
Risk 2 — AUD and GBP exposure. About 25% of CLAR’s assets are in Australia and the UK. A SGD appreciation against AUD or GBP translates directly into lower SGD-denominated DPU, partly offsetting interest savings.
Risk 3 — Debt refinancing timing mismatch. If rates reverse higher before CLAR’s expensive 2022–2023 vintage debt matures, the anticipated savings do not materialise.
None of these risks are fatal to the investment case at current prices. They are, however, the variables to track quarter by quarter. The balance sheet analysis covered here is a starting point, not the whole picture. If you use a broker to hold A17U, the Syfe referral code and sign-up bonus may be worth checking if you hold S-REITs through Syfe’s managed portfolios.
Frequently Asked Questions — CLAR Gearing & Debt 2026
What is CapitaLand Ascendas REIT's current gearing ratio?
How does CLAR's gearing compare to other Singapore industrial REITs?
What percentage of CLAR's debt is at fixed rates?
What is CLAR's interest coverage ratio?
How do Q4 2026 Fed rate cuts benefit CapitaLand Ascendas REIT?
What is the average maturity of CLAR's debt?
Does CLAR have an investment-grade credit rating?
This article was researched with the help of AI. While we strive to keep all information accurate and up to date, there may be errors. If you notice any discrepancies, please contact us.