S-REIT Deep Dive | September 2026
CapitaLand Ascendas REIT (A17U) Share Price & Occupancy Rates 2026: Is Portfolio Resilience Priced In?
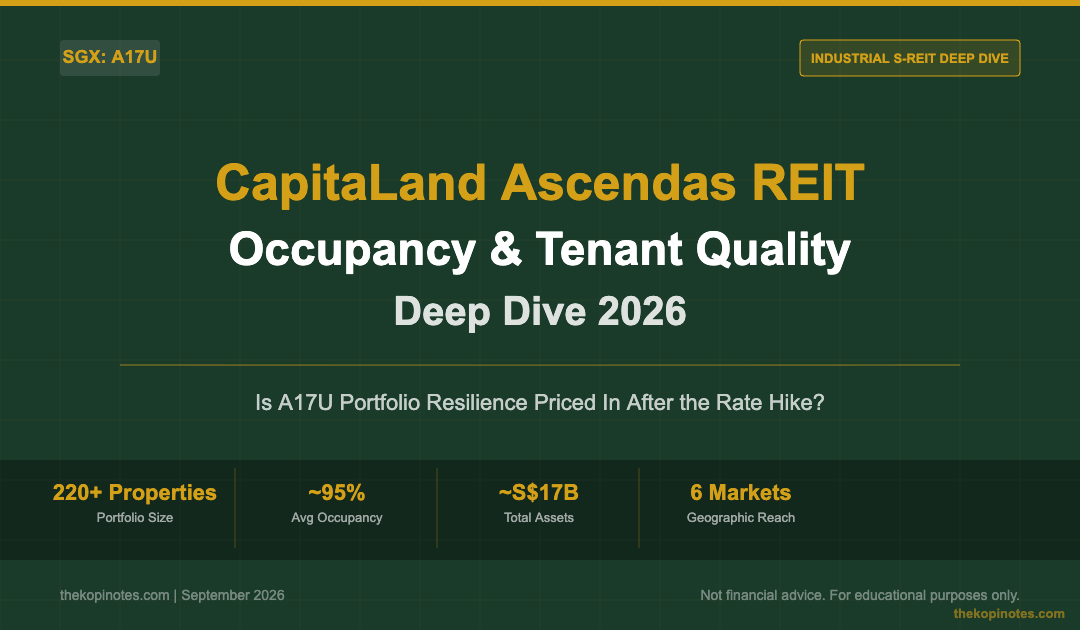
220+ properties across 6 markets — how strong is CLAR's occupancy story after the rate hike?
CapitaLand Ascendas REIT (SGX: A17U) is Singapore's largest industrial S-REIT, with over 220 properties across Singapore, Australia, India, the UK, Europe, and the USA. Its portfolio spans business parks, data centres, logistics facilities, and light industrial space. As of Q2 FY2026, CLAR maintains an overall portfolio occupancy of approximately 94.7% — a key signal of demand resilience even after the Fed's September 2026 rate hike rattled S-REIT prices.
Not financial advice. All figures are for educational reference only. Data as at September 2026 unless noted.
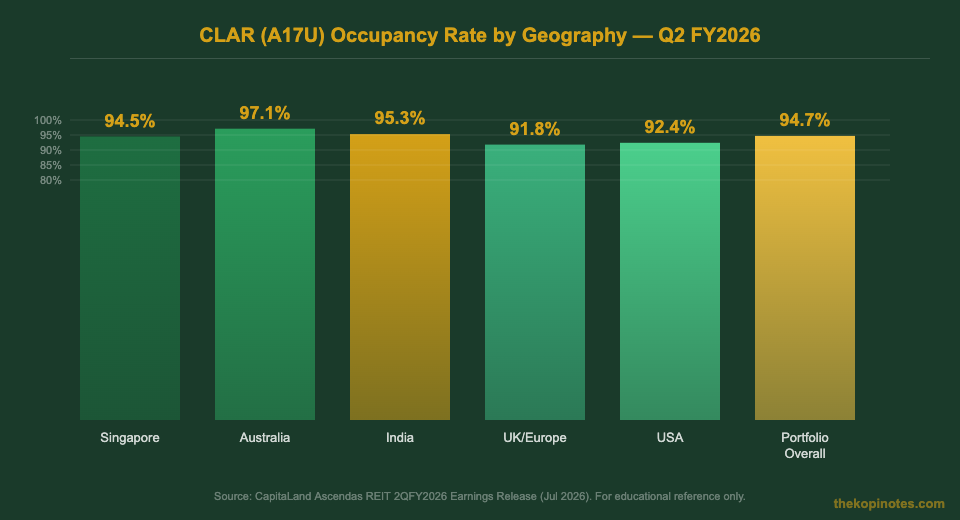
- CLAR's overall portfolio occupancy sits at ~94.7%, with Australia at the highest (97.1%) and UK/Europe at the lowest (91.8%).
- Data centres (~20% of portfolio) and business parks (~38%) drive the most stable rental income — both have long WALEs and blue-chip tenants.
- The share price dip post-rate-hike may offer a re-entry opportunity for income investors, but gearing (~37%) means rate sensitivity is real.
Table of Contents
Click to expand
- What Is CapitaLand Ascendas REIT (A17U)?
- CLAR Occupancy Rates by Geography (2026)
- Portfolio Breakdown: Property Types and Mix
- WALE Analysis: How Sticky Are CLAR's Leases?
- Key Tenants and Sector Diversification
- Share Price Outlook After the Rate Hike
- Should You Buy CLAR at Current Prices?
- Frequently Asked Questions
What Is CapitaLand Ascendas REIT (A17U)?
CapitaLand Ascendas REIT — ticker A17U on the SGX — is Singapore's first and largest industrial S-REIT. It was listed in 2002 and is sponsored by CapitaLand Investment, one of Asia's largest real estate groups.
You might think “industrial” means rows of metal sheds on the outskirts of town. CLAR is nothing like that. Its portfolio spans high-value, knowledge-based real estate — think science parks in one-north, data centres in Singapore and Australia, and Grade A business parks in Hyderabad, India.
As of Q2 FY2026, here is where CLAR stands:
| Metric | Value (Q2 FY2026) |
|---|---|
| Total Portfolio Value | ~S$17.0 billion |
| Number of Properties | ~220+ |
| Geographic Markets | 6 (SG, AU, IN, UK, EU, USA) |
| Overall Occupancy | ~94.7% |
| Aggregate Leverage (Gearing) | ~37.2% |
| Distribution Frequency | Quarterly |
Source: CapitaLand Ascendas REIT 2QFY2026 Earnings Release, July 2026. Approximate figures for educational reference.
CLAR's strength lies in its diversification across geography and property type. No single tenant accounts for more than 5% of gross rental income. That breadth cushions it against any one sector slowdown — which matters a lot after September's rate hike.
CLAR Occupancy Rates by Geography (2026)
Occupancy is the first metric serious REIT investors check. Low occupancy means empty space — and empty space does not pay DPU.
Here is CLAR's occupancy breakdown for Q2 FY2026, across all six geographies:
| Geography | Occupancy Rate | Key Property Types |
|---|---|---|
| Singapore | 94.5% | Business parks, science parks, data centres |
| Australia | 97.1% | Logistics, industrial, suburban offices |
| India | 95.3% | IT parks, business parks (Hyderabad, Pune) |
| UK / Europe | 91.8% | Logistics, urban distribution centres |
| USA | 92.4% | Life science, logistics, suburban offices |
| Portfolio Overall | 94.7% | Blended average |
Source: CapitaLand Ascendas REIT 2QFY2026 Earnings Release, July 2026. Approximate figures for educational reference.
Australia leads the pack at 97.1%. Its logistics facilities — driven by e-commerce demand — have stayed almost fully let. UK/Europe lags at 91.8%, weighed down by softer demand for suburban office space in some European markets.
That 91.8% UK/Europe figure is worth watching. It is not a disaster — anything above 90% is generally considered healthy for an industrial REIT — but it is the only sub-93% market in the portfolio right now.
Portfolio Breakdown: Property Types and Mix
Not all industrial real estate is the same. CLAR's portfolio spans five distinct property categories — each with different demand drivers, lease lengths, and rent escalation potential.
Here is the approximate breakdown by gross asset value:
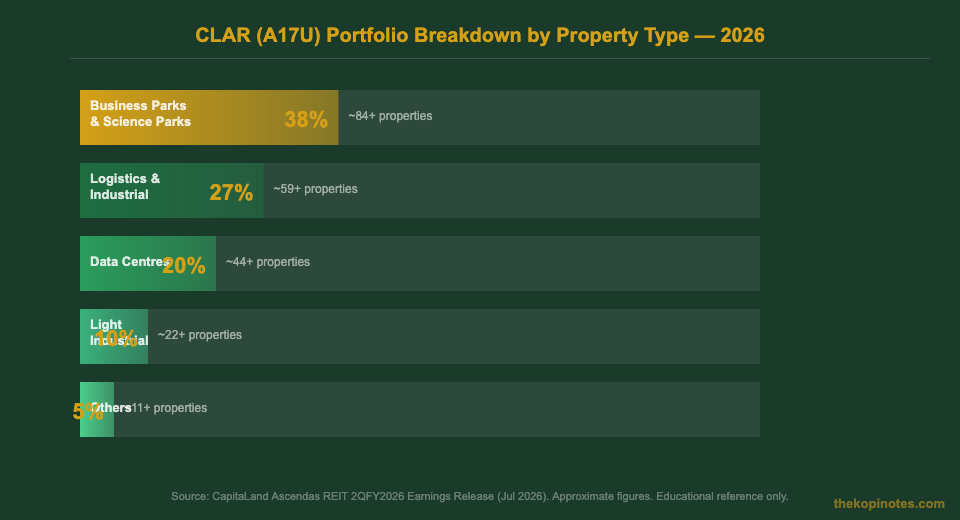
The two biggest categories — business parks and logistics/industrial — together account for about 65% of the portfolio. These are proven, income-generating asset classes with multi-decade track records in Singapore.
Data centres deserve a special mention. At ~20% of portfolio, CLAR's data centre exposure is significant. This is not a recent pivot — CLAR has been building its data centre footprint in Singapore and Australia for over a decade. With AI infrastructure demand exploding in 2025 and 2026, these assets carry a structural demand tailwind that most other property types do not have right now.
For you as an investor, this mix matters for two reasons. First, business parks and data centres tend to command longer leases and higher per-sqft rents — improving income visibility. Second, logistics facilities in Australia and Singapore benefit from e-commerce growth, making them less dependent on the office property cycle.
WALE Analysis: How Sticky Are CLAR's Leases?
WALE stands for Weighted Average Lease Expiry. It tells you how long, on average, tenants are committed to staying in CLAR's properties. A longer WALE means more predictable rental income — and less risk of sudden vacancy spikes.
| Property Segment | WALE (by NLA) | WALE (by GRI) |
|---|---|---|
| Data Centres | 7–10 years | 8–12 years |
| Business Parks (SG) | 4–6 years | 4–7 years |
| IT Parks (India) | 4–5 years | 4–6 years |
| Logistics/Industrial | 3–4 years | 3–5 years |
| Portfolio Overall | ~3.7 years | ~4.5 years |
Source: CapitaLand Ascendas REIT 2QFY2026 Earnings Release. WALE figures are approximate and segment-level estimates. NLA = Net Lettable Area; GRI = Gross Rental Income.
Data centres anchor the WALE. Their lease terms run 7 to 10 years by NLA, and even longer by GRI — because data centre operators need certainty before sinking millions into fit-out and power infrastructure. This is a key reason CLAR's income is more resilient than the headline gearing number might suggest.
Logistics and light industrial leases are shorter — typically 3 to 4 years. That means more frequent renewal risk, but also faster rental escalation in a rising-rent environment. In Singapore and Australia, industrial rents have been moving up steadily throughout 2025 and 2026.
Key Tenants and Sector Diversification
CLAR's tenant base is deliberately diversified. No single tenant contributes more than about 5% of gross rental income. That means no one departure can derail your DPU.
Here is the sector breakdown of CLAR's top tenant industries:
| Tenant Sector | % of GRI (Approx.) | Outlook 2026 |
|---|---|---|
| Technology & Info Comm | ~28% | Strong — AI/cloud expansion |
| Logistics & Supply Chain | ~22% | Stable — e-commerce underpins demand |
| Engineering & R&D | ~15% | Steady — long lease commitments |
| Life Sciences & Healthcare | ~12% | Growing — biomedical cluster expansion (SG) |
| Government & Education | ~8% | Very stable — long-term tenancies |
| Others (retail, F&B, etc.) | ~15% | Mixed — small exposure, low concentration risk |
Source: CapitaLand Ascendas REIT Annual Report 2025 / 2QFY2026 Presentation. Approximate figures for educational reference.
Technology tenants at ~28% of GRI are the single biggest driver — and the sector is benefiting from AI infrastructure build-out. Companies expanding data centre capacity and cloud infrastructure need the kind of space CLAR provides. This is not a theoretical tailwind; it is showing up in rental renewals and lease-up activity in Singapore and Australia.
If you look at the Singapore REIT ETF guide, CLAR is consistently among the top holdings — precisely because of this tenant quality and diversification.
Share Price Outlook After the Rate Hike
CLAR's share price fell in line with most S-REITs after the Fed's September 2026 rate hike. Higher rates hurt REITs in two ways: they raise borrowing costs on floating-rate debt, and they make the REIT's yield look less attractive compared to risk-free alternatives like Singapore T-bills.
For CLAR, the rate sensitivity is moderate. Its aggregate leverage sits at ~37.2% — below the regulatory ceiling of 50% and below the 40% level that typically triggers meaningful refinancing pressure. Approximately 65–70% of its debt is on fixed rates, which limits the immediate impact of rate rises on financing costs.
That said, any floating-rate debt will reprice higher when it rolls over. This is why you should check CLAR's debt maturity profile in each quarterly report — staggered maturities are good; a cliff in one year is a risk.
As of Q2 FY2026, CLAR's debt maturity profile is well-staggered across 2026 to 2031, with no single year representing more than ~20% of total borrowings. That reduces refinancing cliff risk significantly.
For income investors, the more relevant question is whether CLAR's DPU can hold. Given occupancy rates above 94%, a sticky WALE anchored by data centre leases, and rising industrial rents in key markets, the income floor looks reasonably solid. We covered DPU sustainability in detail in a previous CLAR deep dive.
Should You Buy CLAR at Current Prices?
This is not financial advice — and you should always do your own research or consult a licensed advisor before investing. That said, here are the key factors to weigh:
The case for CLAR: Strong occupancy across all six markets. Best-in-class diversification across property type and geography. Tech-sector tenant tailwinds from AI and cloud. A data centre sub-portfolio with very long WALE. And a sponsor in CapitaLand Investment with a deep asset pipeline.
The case for caution: Gearing at ~37% means interest rate sensitivity is real. UK/Europe occupancy lagging at 91.8% needs to recover. The share price re-rating will depend partly on when rates start to come down — which is uncertain. For retirement planning, consider using a Singapore retirement calculator to figure out how much S-REIT exposure makes sense for your overall portfolio.
If you want exposure to Singapore's industrial property story — including data centres, science parks, and logistics — CLAR is the benchmark REIT to understand first. Whether you buy directly or through a fund, look at the Singapore REIT ETF guide for a passive approach. Platforms like Syfe (referral code: SRPRFFFCD) and FSMOne make it easy to start. You can also check what the best S-REITs in Singapore 2026 look like for comparison.
If you prefer passive income through a broader basket, explore passive income strategies in Singapore 2026 for a fuller picture beyond just CLAR.
Frequently Asked Questions About CLAR (A17U)
What is CapitaLand Ascendas REIT's current occupancy rate?
What types of properties does CLAR own?
Is CapitaLand Ascendas REIT a good long-term investment?
How often does CLAR pay dividends (DPU)?
What is CLAR's gearing ratio and is it safe?
How does CLAR compare to other industrial S-REITs like Mapletree Industrial Trust?
Start Investing in S-REITs
Use these platforms to invest in CLAR and other S-REITs. Referral codes below unlock sign-up bonuses where available.
Not financial advice. Referral codes may earn TKN a fee. Always do your own research before investing.
This article was researched with the help of AI. While we strive to keep all information accurate and up to date, there may be errors. If you notice any discrepancies, please contact us.