Sasseur REIT Share Price 2026 (SGX: CRPU): DPU, Yield & China Outlet Deep-Dive
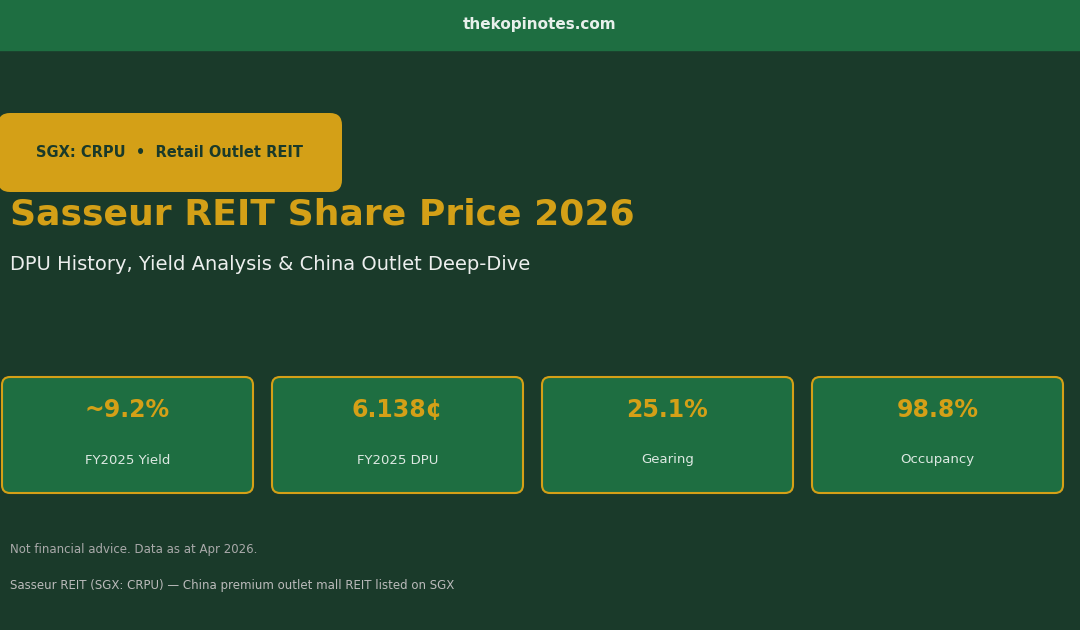
Singapore’s only China premium outlet mall REIT — trading at ~9.2% yield, 25.1% gearing, 98.8% occupancy. Here’s everything Singapore investors need to know in 2026.
This article is not financial advice. All data is sourced from SGX announcements, Sasseur REIT investor relations materials, and publicly available research reports. Always conduct your own due diligence before making any investment decisions.
Sasseur REIT (SGX: CRPU) is a one-of-a-kind play in the Singapore REIT universe — it’s the only S-REIT that gives unitholders exposure to China’s fast-growing premium outlet mall sector. With a forward yield of approximately 9.2% and an ultra-low gearing ratio of 25.1%, it consistently stands out in any S-REIT comparison table. But is the high yield justified by fundamentals, or does the China risk premium make it a trap?
In this deep-dive, we break down Sasseur REIT’s share price performance, DPU history, outlet portfolio, and what the FY2025 results mean for investors in 2026.
Table of Contents
Contents — Click to expand
- Sasseur REIT at a Glance
- Share Price Performance & Valuation (2026)
- DPU History: FY2020–FY2025
- FY2025 Full-Year Results Breakdown
- The Outlet Portfolio: Four Malls, One Mission
- The EMA Model: How Sasseur REIT Makes Money
- Yield Comparison vs Singapore Retail REIT Peers
- Key Risks: China Macro, RMB & Concentration
- Outlook for 2026: Rate Cuts & Consumer Recovery
- Frequently Asked Questions
Sasseur REIT at a Glance
Sasseur REIT was listed on SGX in March 2018 at an IPO price of S$0.80 per unit. It is managed by Sasseur Asset Management Pte Ltd and holds a portfolio of four premium outlet malls across China’s Tier 2 cities — Chongqing (two malls), Hefei, and Kunming.
| Metric | Value (Apr 2026) |
|---|---|
| SGX Ticker | CRPU |
| Share Price | ~S$0.665 |
| FY2025 DPU | 6.138 Singapore cents |
| Forward Yield | ~9.2% |
| NAV per Unit (implied) | ~S$0.81 |
| P/NAV | ~0.82x (trading below book) |
| Gearing Ratio | 25.1% — one of lowest in S-REITs |
| Portfolio Occupancy (Q4 FY2025) | 98.8% |
| Number of Properties | 4 outlet malls in China |
| Portfolio Valuation (Dec 2025) | RMB 8.36 billion |
| Cost of Debt | 4.4% p.a. (down from 5.3%) |
Share Price Performance & Valuation (2026)
As at April 2026, Sasseur REIT (SGX: CRPU) is trading at approximately S$0.665 per unit. This represents a 17% discount to its implied NAV of ~S$0.81 per unit (P/NAV of ~0.82x). For income-focused investors, this discount combined with the ~9.2% forward yield presents a compelling entry point — if you’re comfortable with China risk.
The share price has been range-bound between roughly S$0.60 and S$0.80 over the past two years. The main headwinds have been: RMB depreciation against SGD (which compresses DPU in Singapore dollar terms), China consumer sentiment concerns, and the broader macro uncertainty around US-China trade tensions.
Importantly, Sasseur REIT’s share price trajectory differs from Singapore domestic REITs like Frasers Centrepoint Trust or Mapletree Industrial Trust — it is driven primarily by China macro conditions and the RMB/SGD exchange rate, not Singapore interest rates or local property cycles.
The analyst consensus target price of ~S$0.89 represents ~34% upside from current levels, though this is based on a normalised China consumer recovery scenario and a stable RMB.
DPU History: FY2020–FY2025
Sasseur REIT’s distribution per unit (DPU) history tells a story of initial COVID disruption, recovery to peak in FY2021, and then a gradual drift lower as RMB depreciated and China’s post-COVID consumer recovery disappointed. FY2025 marks the beginning of a reversal — DPU rose 0.9% year-on-year to 6.138 cents, driven by record EMA income and a sharply lower cost of debt.

| Financial Year | DPU (Singapore Cents) | YoY Change | Approx. Yield at S$0.665 |
|---|---|---|---|
| FY2020 | 6.545¢ | — | 9.8% |
| FY2021 | 7.104¢ | +8.5% | 10.7% 🏆 Peak |
| FY2022 | 6.550¢ | -7.8% | 9.8% |
| FY2023 | 6.249¢ | -4.6% | 9.4% |
| FY2024 | 6.082¢ | -2.7% | 9.1% |
| FY2025 ✅ | 6.138¢ | +0.9% ↑ | 9.2% |
Source: Sasseur REIT SGX announcements, Growbeansprout. DPU in Singapore cents. Yield calculated at S$0.665 share price. Past distributions are not indicative of future distributions.
FY2025 Full-Year Results Breakdown
Sasseur REIT released its FY2025 full-year financial results on 26 February 2026, reporting a distribution per unit of 6.138 Singapore cents — a 0.9% increase over FY2024’s 6.082 cents. This was a welcome reversal after three consecutive years of declining DPU (FY2022–FY2024). Here are the headline numbers:
| Metric | FY2025 | FY2024 | Change |
|---|---|---|---|
| Full-Year DPU | 6.138¢ | 6.082¢ | +0.9% |
| 2H DPU | 3.083¢ | 2.928¢ | +5.3% |
| EMA Rental Income | RMB 682.3M | RMB 664.5M | +2.7% |
| Portfolio Valuation | RMB 8.36B | RMB 8.42B | -0.7% |
| Cost of Debt | 4.4% p.a. | 5.3% p.a. | -90bps ✅ |
| Gearing Ratio | 25.1% | ~26% | Improving |
| Portfolio Occupancy (Q4) | 98.8% | ~98% | Stable/Improving |
The standout item is the 90 basis point reduction in cost of debt, achieved by refinancing RMB 906 million in loans into five-year RMB bank facilities at lower rates. Management expects the cost of debt to fall further below 4.5% in FY2026 as they continue to optimise their onshore borrowing mix. This is a significant tailwind for DPU — every 50bps reduction in debt cost adds approximately 0.1–0.2 cents to the annual DPU.
The full-year DPU growth of 0.9% was dampened by RMB depreciation against SGD. In RMB terms, outlet performance was meaningfully stronger. This currency translation headwind has been a persistent drag on Sasseur REIT’s DPU and is the key risk factor investors must price in.
The Outlet Portfolio: Four Malls, One Mission
Sasseur REIT’s entire portfolio consists of four premium outlet malls located in fast-growing Tier 2 and Tier 2.5 cities in China. The “premium outlet” model targets middle-to-upper income Chinese consumers seeking branded goods at discounted prices — a format that has proven remarkably resilient even during China’s macro slowdowns.
| Outlet Mall | City | GFA (sqm) | Occupancy (Q4 FY2025) |
|---|---|---|---|
| Chongqing Liangjiang Outlet | Chongqing | ~120,000 | 100% 🏆 Record |
| Chongqing Bishan Outlet | Chongqing | ~95,000 | ~98% |
| Hefei Outlet | Hefei | ~135,000 | ~99% |
| Kunming Outlet | Kunming | ~130,000 | ~98% |
Source: Sasseur REIT SGX announcements. GFA figures are approximate. As at Q4 FY2025 (December 2025).
The Hefei outlet is undergoing an asset enhancement initiative (AEI) — a ~2,000 sqm cinema space on level 3 is being reconfigured into a multi-tenanted F&B and experiential zone. This type of conversion is a proven strategy to increase shopper dwell time and spending, and should enhance the Hefei outlet’s EMA contribution in FY2026 and beyond.
Chongqing Liangjiang achieving 100% occupancy in Q4 FY2025 is a remarkable achievement and signals strong retailer demand for prime outlet space in one of China’s fastest-growing municipalities.
The EMA Model: How Sasseur REIT Makes Money
Sasseur REIT uses a unique income structure called the Entrusted Management Agreement (EMA). Unlike traditional REITs that collect fixed rent from tenants, Sasseur REIT’s income is calculated as a percentage of each outlet mall’s total sales — with a guaranteed base component and an additional variable component tied to sales performance.
The EMA formula is: EMA income = Base Rent Component + Variable Component (tied to outlet sales). This structure means Sasseur REIT benefits directly when outlet sales grow, and provides a minimum income floor via the base component. It’s a hybrid between fixed-rent and turnover-rent structures.

FY2025 EMA rental income reached RMB 682.3 million — a record high and a 2.7% increase year-on-year. This growth was driven by higher outlet sales across all four malls, particularly the flagship Chongqing Liangjiang outlet and the improving Hefei mall.
The EMA structure is both a strength and a source of complexity. On the plus side, Sasseur REIT is not exposed to tenant credit risk in the same way a typical retail REIT is — the income is collected from the sponsor (Sasseur Holdings) based on total sales, not from individual tenant leases. On the minus side, income in SGD terms is subject to both the RMB/SGD exchange rate and the performance of China’s consumer economy.
Yield Comparison vs Singapore Retail REIT Peers
How does Sasseur REIT’s ~9.2% yield compare to other Singapore-listed retail REITs? The table and chart below put the numbers in context. Note that Sasseur REIT’s higher yield partly reflects the China risk premium — investors demand more compensation for currency and geographic concentration risk compared to domestic Singapore retail assets.

| REIT | Asset Type | Forward Yield | Gearing |
|---|---|---|---|
| Sasseur REIT (CRPU) | China outlet malls | ~9.2% | 25.1% |
| Lendlease REIT (JYEU) | Singapore & Australia | ~7.5% | ~37% |
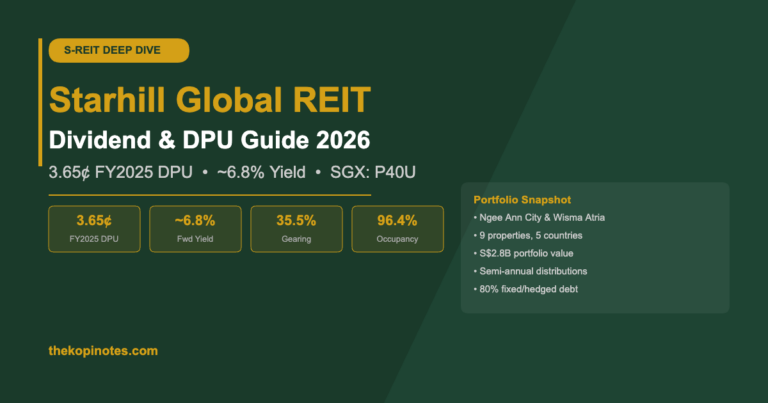
| Starhill Global REIT (P40U) | SG + overseas retail | ~7.2% | ~36% |
| Frasers Centrepoint Trust (J69U) | Singapore suburban | ~5.8% | ~38% |
| CapitaLand Integrated Commercial Trust (C38U) | SG integrated | ~5.5% | ~40% |
Yield estimates as at April 2026. For informational purposes only. Not financial advice.
Sasseur REIT’s gearing of 25.1% is the clear outlier — it has approximately S$867 million in debt headroom before approaching the MAS 45% regulatory limit. This gives the REIT significant capacity for acquisitions or capital recycling without needing an equity raise. The question is whether suitable acquisition targets in China’s outlet mall space meet the manager’s IRR hurdle rates.
Key Risks: China Macro, RMB & Concentration
Sasseur REIT is not for every investor. The risk profile is meaningfully different from Singapore-focused S-REITs. Before investing, consider these key risk factors:
1. RMB/SGD Currency Risk
All EMA income is denominated in RMB and converted to SGD for distribution. When RMB weakens against SGD (as it has done over the past 2–3 years), DPU in Singapore cent terms falls even if outlet sales grow. This is the single biggest drag on Sasseur REIT’s DPU and share price performance. Sasseur REIT does not hedge its RMB exposure.
2. China Consumer Macro
Sasseur REIT’s income is directly tied to China’s consumer spending. Weakness in China’s economy, property market stress affecting consumer confidence, or deflationary pressures can reduce outlet sales and thus EMA income. The 2022–2024 period showed exactly this dynamic — China’s post-COVID recovery was slower than expected, and Sasseur’s DPU declined as a result.
3. Concentration Risk
Four properties in four cities, all in China, with no diversification into other asset classes or geographies. If a specific mall underperforms or requires capex, there is limited portfolio resilience to absorb the impact. Compare this to the 200+ property portfolios of CapitaLand Ascendas REIT or Mapletree Logistics Trust.
4. Sponsor Dependency via EMA
Income flows through the EMA with the Sasseur Holdings sponsor, not directly from tenants. This introduces counterparty concentration — if Sasseur Holdings faces financial stress, the EMA payments could be at risk. The sponsor’s financial health is a key due diligence item for potential investors.
5. Regulatory / Geopolitical Risk
Any deterioration in Singapore-China relations, changes to China’s foreign-invested enterprise rules, or increased tax burden on REIT distributions could affect Sasseur REIT’s ability to repatriate income.
Outlook for 2026: Rate Cuts & Consumer Recovery
The macro tailwinds for Sasseur REIT in 2026 are the most favourable they’ve been since pre-COVID. Here’s the bull case:
Lower Cost of Debt: Management has already reduced the cost of debt from 5.3% to 4.4% p.a. and expects further reductions below 4.5% in FY2026 as the new RMB 906 million five-year onshore bank facilities kick in fully. This directly boosts DPU with no corresponding growth in revenue required.
China Consumer Recovery: China has been implementing targeted stimulus measures to revive consumer spending. If the golden week holidays (especially National Day in October 2026) deliver strong outlet sales, Sasseur REIT’s variable EMA income component should rise meaningfully.
Hefei AEI Completion: The asset enhancement at Hefei’s level 3 — converting cinema space to F&B and experiential retail — should complete in FY2026 and add new revenue-generating capacity to one of the portfolio’s key assets.
Undemanding Valuation: Trading at 0.82x NAV and offering ~9.2% yield with 25.1% gearing leaves Sasseur REIT’s unit price with meaningful re-rating potential if China sentiment improves. Analysts’ consensus target of ~S$0.89 implies ~34% total return potential over 12 months (capital + distributions).
The bear case is a continued weak RMB and slower-than-expected China consumer recovery, which would keep the DPU growth flat and the unit price range-bound between S$0.60–S$0.70. Investors should calibrate position sizing accordingly.
For a broader view of S-REIT sector dynamics, see our Best S-REITs Singapore 2026 comparison, and use the S-REIT Yield vs SGS Bond Spread Calculator to model Sasseur REIT’s yield spread in different rate environments.
Frequently Asked Questions
What is Sasseur REIT's share price today (April 2026)?
As at April 2026, Sasseur REIT (SGX: CRPU) is trading at approximately S$0.665 per unit. The share price has been range-bound between roughly S$0.60 and S$0.80 over the past two years. Always check the SGX or your brokerage platform for the live price before making any investment decisions.
What is Sasseur REIT's dividend yield in 2026?
Based on the FY2025 DPU of 6.138 Singapore cents and a share price of approximately S$0.665, Sasseur REIT offers a trailing yield of approximately 9.2%. This is one of the highest yields among all Singapore-listed REITs. Distributions are paid twice a year (half-yearly). Past distributions are not indicative of future distributions.
How does Sasseur REIT's EMA structure work?
Sasseur REIT uses an Entrusted Management Agreement (EMA) structure. Rather than collecting rent directly from outlet tenants, the REIT receives income from the sponsor (Sasseur Holdings) calculated as a percentage of total outlet sales — comprising a base component (minimum guaranteed income) plus a variable component linked to actual sales performance. This provides income stability via the base rent while allowing upside participation when China consumer spending is strong.
Is Sasseur REIT a good investment in 2026?
This is not financial advice. Sasseur REIT offers compelling fundamentals for risk-tolerant income investors: ~9.2% yield, extremely low 25.1% gearing, record 98.8% occupancy, and improving DPU momentum. However, it carries significant China macro risk, RMB/SGD currency translation risk, and concentration risk (4 assets, 1 country). Whether it is a good investment depends on your individual risk tolerance, portfolio composition, and view on China’s consumer recovery. Consult a licensed financial adviser before investing.
What is Sasseur REIT's gearing ratio?
As at FY2025 (December 2025), Sasseur REIT’s gearing ratio is 25.1% — one of the lowest among all Singapore-listed REITs. The MAS regulatory limit is 45% (or 50% with a credit rating). This means Sasseur REIT has approximately S$867 million in additional debt capacity before reaching the 45% cap, giving it significant room for acquisitions or refinancing without equity dilution.
How does Sasseur REIT compare to other retail S-REITs?
Sasseur REIT stands apart from Singapore-focused retail REITs (like Frasers Centrepoint Trust or CapitaLand Integrated Commercial Trust) in three main ways: (1) All assets are in China, not Singapore, giving pure-play China outlet exposure; (2) the income structure is EMA-based (linked to outlet sales), not fixed-rent leases; and (3) the yield is significantly higher (~9.2% vs ~5-6% for Singapore retail REITs) to compensate for the additional risks. Compare retail REIT options using our REITs Dividend Yield Calculator.
Start Investing in S-REITs with These Platforms
Compare referral bonuses and fees before you pick a platform to invest in Sasseur REIT or other S-REITs:
- Endowus Referral Code — invest CPF/SRS/cash in REITs and ETFs, get S$20 access fee rebate
- Syfe Referral Code — robo-advisor with S-REIT portfolio option, fee waivers for new signups
- FSMOne Referral Code — buy SGX stocks and REITs, brokerage from 0.08%
Disclaimer: This article is for informational purposes only and does not constitute financial advice. Past performance and distributions are not indicative of future results. The author may hold units in REITs mentioned. Always conduct your own due diligence and consult a licensed financial adviser before investing.
This article was researched with the help of AI. While we strive to keep all information accurate and up to date, there may be errors. If you notice any discrepancies, please contact us.