Mapletree Logistics Trust (M44U): Japan Portfolio Deep Dive — How JPY Recovery Boosts Your DPU in 2026
Mapletree Logistics Trust (SGX: M44U) earns roughly 21% of its total assets under management from Japan — about S$2.9 billion across ~40 logistics properties. That makes Japan the REIT’s second-largest market and its single biggest source of foreign-currency DPU sensitivity. When the Japanese yen strengthens against the Singapore dollar, SGD-denominated DPU rises. With the Fed set to cut rates on September 17, 2026, and the JPY already recovering from its historic lows, this article breaks down exactly how much DPU upside Japan gives MLT — and what the buy zone looks like.
Not financial advice. All figures are for educational reference only. Data as at September 2026 unless noted.
- Japan is MLT’s #2 market at 21% AUM — a weaker JPY directly cuts SGD DPU, and a stronger JPY does the opposite
- Every 5% JPY appreciation vs SGD adds an estimated 0.11–0.15 cents to annual DPU from the Japan book alone
- The Sep 17 FOMC rate cut is a structural JPY tailwind — historically, Fed cuts narrow the JPY/USD carry trade and push the yen higher
What Is MLT’s Japan Portfolio?
Mapletree Logistics Trust owns logistics real estate across eight markets in Asia-Pacific. Japan is the second-largest country allocation by AUM, after Singapore.
Here is the breakdown as at Q1 FY2026/27 (April–June 2026):
| Country | AUM Share | Est. AUM (S$B) | No. of Properties |
|---|---|---|---|
| Singapore | 26% | ~S$3.6B | ~54 |
| Japan | 21% | ~S$2.9B | ~40 |
| China | 14% | ~S$1.9B | ~40 |
| Australia | 13% | ~S$1.8B | ~28 |
| South Korea | 10% | ~S$1.4B | ~11 |
| Vietnam + Others | 16% | ~S$2.2B | ~15 |
Source: MLT FY2025/26 Annual Report, Mapletree Investor Relations. Figures rounded.
Japan’s properties are predominantly modern, multi-tenanted logistics facilities in Greater Tokyo, Osaka, Nagoya, and Fukuoka. Occupancy has held above 98% for the past three financial years. The portfolio is also 100% freehold or long-leasehold — a structural quality advantage over some peers.
The key point: all Japan revenue is collected in JPY, then converted to SGD for DPU distribution. That FX conversion is where the opportunity — and the risk — sits.
JPY/SGD Sensitivity: The Math
MLT does not fully hedge its Japan income. The manager typically uses partial natural hedging (local debt in JPY) and selective forward contracts, but a meaningful portion of Japan NPI flows into SGD at spot rates.
Here is how to think about the sensitivity:
- Japan NPI represents roughly 18–20% of total portfolio NPI
- At FY25/26 exchange rates (~104 JPY/SGD), Japan contributed approximately 1.45–1.55 cents to the 7.26c annual DPU
- A 5% strengthening in JPY (from 104 to ~99 JPY/SGD) would add roughly 0.07–0.08 cents to annual DPU from Japan alone
- A 10% JPY strengthening (to ~94 JPY/SGD) would add approximately 0.14–0.16 cents
To put this in context: MLT’s FY25/26 DPU was 7.26 cents. A 10% JPY recovery takes Japan’s contribution from ~1.50c to ~1.65c — a 10% uplift on that segment alone.
That might sound small. But combined with the broader interest rate tailwind on MLT’s floating-rate debt, the total DPU uplift from two Fed cuts could be 0.30–0.50 cents over 12 months. That is a 4–7% DPU recovery from current levels.
Why the Sep 17 FOMC Is a JPY Catalyst
The JPY has been structurally weak since 2021 because of the carry trade. Investors borrowed cheaply in Japan (near-zero rates) and invested the proceeds in higher-yielding assets elsewhere — particularly US Treasuries.
When the Fed cuts rates, US yields fall. The carry trade becomes less attractive. Capital flows back into Japan, pushing the yen higher.
This is not speculation. It happened in the second half of 2024, when the Fed’s first rate-cut cycle caused a sharp JPY rally. From its 2024 low of ~160 JPY/USD, the yen recovered to ~140 by early 2025. That recovery directly lifted MLT’s Japan NPI in SGD terms.
With the Fed cutting again in September 2026, the same dynamic is in play. For MLT unitholders, a stronger JPY is a free earnings tailwind — no operational change needed.
DPU Recovery Roadmap After the Fed Cuts
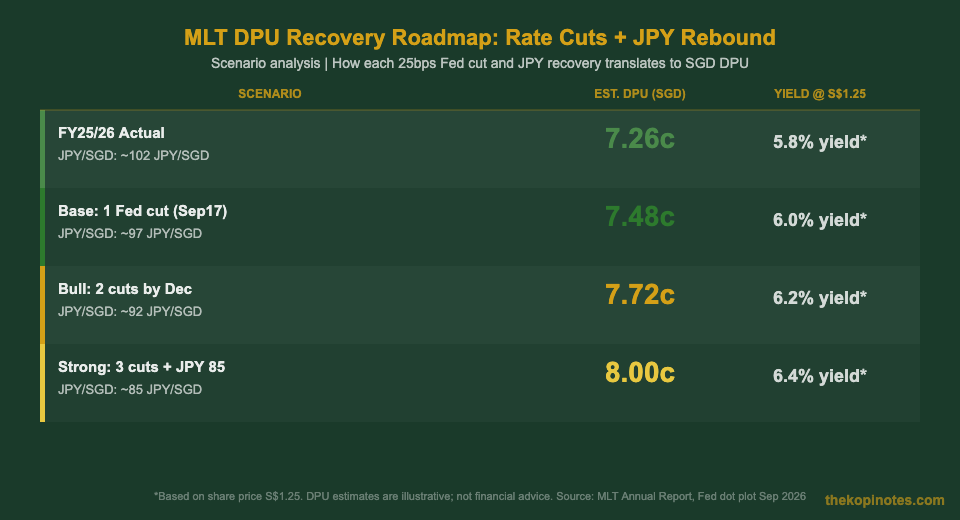
The chart above shows four DPU scenarios for MLT based on the number of Fed rate cuts and the corresponding JPY recovery.
These are illustrative estimates based on two variables:
- Lower interest cost: MLT had S$5.9B of gross borrowings as at FY25/26, with roughly 75% at fixed rates. Each 25bps cut lowers floating-rate interest cost by approximately S$3–4M annually, adding ~0.04–0.05c to DPU.
- JPY appreciation: Each 5% move in JPY/SGD adds ~0.07–0.08c (as calculated above).
In the base case (one Fed cut Sep 17, JPY moves to ~97/SGD), estimated DPU recovers to ~7.48 cents — a 3% uplift from FY25/26. At a share price of S$1.25, that is a forward yield of approximately 6.0%.
In the bull case (two cuts by December + JPY to 92/SGD), DPU could reach ~7.72 cents — a yield of 6.2% on the same price.
The strong case assumes three cuts and JPY at 85/SGD — historically not unusual during Fed easing cycles. That would push DPU to approximately 8.0 cents, or a 6.4% yield. That is competitive with the best S-REITs in Singapore for 2026.
None of this is guaranteed. MLT’s China portfolio carries occupancy headwinds, and the AUD is also a variable. But the Japan FX lever is real and measurable.
Full Geographic Breakdown
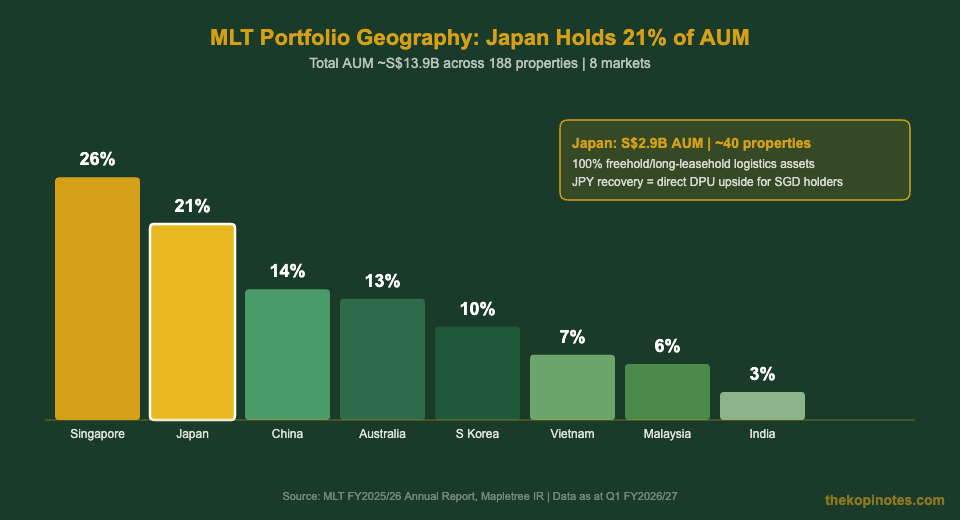
Beyond Japan, it is worth understanding how the rest of the portfolio behaves in a rate-cut environment.
Singapore (26% AUM): Highest quality, lowest FX risk (SGD-denominated). Occupancy near 100%. However, Singapore contributes zero FX upside from rate cuts — it is a stable base, not a growth driver.
China (14% AUM): The main drag. Occupancy has trailed at 85–90% amid weak domestic consumption. China contributes CNY, which has been relatively stable vs SGD, but the operational softness is a net negative vs FY24 levels. Improving China macro could unlock upside, but this is separate from the rate-cut thesis.
Australia (13% AUM): AUD-denominated. The AUD has a moderate positive correlation with global risk appetite and commodity prices. If the Fed cuts and risk assets rally, AUD could also strengthen — a secondary tailwind. Australia occupancy is strong at ~98%.
South Korea (10% AUM): KRW-denominated. Tight occupancy in Korean logistics. The KRW is sensitive to USD strength, so Fed cuts could provide mild FX tailwind here too.
The key takeaway: Japan is the largest single FX variable in MLT’s portfolio. Singapore anchors stability. China is the swing factor on the downside. Australia and Korea are secondary tailwinds.
For investors focused on passive income in Singapore, MLT’s geographic mix means the Sep 17 FOMC is more meaningful here than for Singapore-only REITs like Frasers Centrepoint Trust.
P/NAV Valuation and Historical Buy Zones
MLT’s NAV per unit as at 31 March 2026 (FY25/26 year-end) was approximately S$1.48–1.52 per unit (varies by source and revaluation date).
At a share price of S$1.25 (as at mid-September 2026), the REIT trades at approximately 0.82–0.85x P/NAV. That is a 15–18% discount to book value.
Here is how that compares historically:
| Period | MLT Share Price | P/NAV | Context |
|---|---|---|---|
| Pre-COVID peak (2019) | ~S$1.50 | ~1.20x | Low-rate environment, strong logistics demand |
| COVID boom peak (2021) | ~S$2.00 | ~1.45x | E-commerce surge, zero-rate frenzy |
| Rate hike trough (2023) | ~S$1.55 | ~1.05x | Yields rose, REIT prices compressed |
| Post-rate-cut recovery (2024) | ~S$1.65 | ~1.10x | China drag held price below 2019 peak |
| Sep 2026 (current) | ~S$1.25 | ~0.83x | China headwind + JPY weakness = maximum pessimism |
Source: SGX, Bloomberg, MLT Annual Reports. Historical prices approximate; not investment advice.
The current P/NAV of ~0.83x is the lowest in over a decade, excluding the brief COVID crash in March 2020. Historically, MLT has re-rated to 1.0–1.1x P/NAV during normal operating conditions and rising DPU cycles.
A recovery to 1.0x P/NAV implies a share price of approximately S$1.48–1.52. That is 18–22% upside from current levels. Combined with a 6%+ forward yield in the bull case, the total potential return profile is meaningful — if Japan FX and China occupancy both recover.
You can model your own return scenarios using the Singapore retirement planning calculator to see how a REIT position fits into a broader income portfolio.
MLT vs Peers: Why Japan Exposure Matters
Among the large-cap S-REITs, MLT has more Japan exposure than any other logistics or industrial REIT listed in Singapore. That makes it uniquely sensitive to JPY movements.
| REIT | Japan Exposure | FY25/26 DPU | Forward Yield* |
|---|---|---|---|
| Mapletree Logistics Trust (M44U) | 21% AUM | 7.26c | ~5.8% |
| Mapletree Industrial Trust (ME8U) | ~10% (data centres) | ~12.7c | ~5.5% |
| CapitaLand Ascendas REIT (A17U) | Nil | ~15.5c | ~5.2% |
| ESR-LOGOS REIT (J91U) | ~8% | ~3.0c | ~7.5% |
*Yield based on share prices as at September 2026. Approximate only. Source: SGX, company IR pages.
If you believe the JPY will recover post-FOMC, MLT is the purest S-REIT play on that thesis. No other large-cap Singapore-listed industrial or logistics REIT has as much Japan revenue concentration.
That said, if you want Japan exposure without single-REIT risk, the broader S-REIT ETF route is worth considering — the Singapore REIT ETF guide covers the main options including Lion-Phillip S-REIT ETF and NikkoAM-STC Asia REIT ETF.
If you use Endowus, FSMOne, or Syfe to build your S-REIT portfolio, check out their referral codes. You can get the Endowus referral code, the FSMOne referral code, and the Syfe referral code and sign-up bonus to offset some of the initial fees.
Key Risks to Watch
The Japan FX thesis is compelling, but it is not a free lunch. Here are the main risks:
1. China occupancy deterioration. China at 14% AUM has been the main drag on MLT’s portfolio for the past two years. If occupancy falls further — due to oversupply in Tier 2 cities or weak consumer demand — it could offset Japan FX gains. Watch the quarterly business updates for China NPI trends.
2. JPY reversal. The carry trade is structural. If the Bank of Japan unexpectedly cuts rates or keeps policy loose, the JPY could weaken again despite Fed cuts. JPY is notoriously volatile and difficult to predict.
3. Gearing and refinancing risk. MLT’s aggregate leverage is approximately 37–38%, which is within MAS limits but leaves limited headroom. Rising property values help (they lower the gearing ratio), but if capital values fall, the REIT could face equity fundraising pressure. Monitor the upcoming property revaluations.
4. Execution on Japan acquisitions. MLT has continued to grow its Japan portfolio through acquisitions. If deal pricing becomes expensive (cap rates compress too much), future acquisitions may be DPU-dilutive rather than accretive.
None of these risks invalidate the thesis. They are factors to track, not reasons to dismiss the opportunity.
Frequently Asked Questions
What is Mapletree Logistics Trust's Japan portfolio size?
How does the Japanese yen affect MLT's DPU?
Why does the September 2026 FOMC rate cut matter for MLT?
What is MLT's current yield and P/NAV?
What are the main risks of investing in MLT?
How does MLT compare to other S-REITs for Japan exposure?
Where can I buy MLT shares in Singapore?
This article was researched with the help of AI. While we strive to keep all information accurate and up to date, there may be errors. If you notice any discrepancies, please contact us.