
S-REIT Dividend Discount Model (DDM) Fair Value Calculator Singapore 2026
Estimate a Singapore REIT’s intrinsic fair value using the Gordon Growth and two-stage Dividend Discount Model — free, real-time results in SGD.
S-REIT Fair Value Inputs (Dividend Discount Model)
Estimated Fair Value
Educational estimate only, not financial advice. The Dividend Discount Model is highly sensitive to your growth and discount rate assumptions — use it as one input among several, not a precise price target.
Understanding the Dividend Discount Model for Singapore REITs
The Dividend Discount Model (DDM) values an income-producing asset as the present value of the cash it’s expected to pay out in future. S-REITs are a natural fit for this model — MAS requires them to distribute at least 90% of taxable income to unitholders in order to enjoy tax-transparency treatment, so a REIT’s distribution per unit (DPU) is a far more predictable, policy-anchored cash stream than an ordinary company’s discretionary dividend. This calculator lets you plug in a REIT’s current DPU, your expected growth assumptions, and your required rate of return to estimate what the units are worth today — and compare that fair value against the current market price.
Not financial advice. All figures are for educational reference only. Data as at Q3 2026 unless noted.
Why use DDM alongside P/NAV and yield-spread analysis
Most Singapore retail investors size up a REIT using its distribution yield or its Price-to-NAV ratio. Both are useful, but neither directly answers “what should this REIT be worth given how fast its distributions are likely to grow?” DDM fills that gap. It won’t replace a look at gearing, WALE or occupancy — use metrics like P/NAV, gearing, WALE and occupancy for that — but it adds a genuinely different, growth-and-discount-rate-driven lens to the same REIT.
What you need before you start
You’ll want the REIT’s trailing 12-month DPU (from its latest financial results or SGX StockFacts), the current unit price, a view on long-run DPU growth (rental reversions, acquisitions, AEIs), and a required rate of return that reflects the REIT’s risk profile. The sections below walk through how to estimate that last input, which is usually the hardest part.
How to Use This DDM Fair Value Calculator
- Current Annual DPU: Enter the REIT’s trailing 12-month distribution per unit in SGD (e.g. S$0.100 for a REIT paying 10 cents/unit a year).
- Current Market Price: Enter today’s unit price so the calculator can show your margin of safety and upside/downside.
- Required Rate of Return: Set the discount rate you need to be compensated for the REIT’s risk — see the worked guidance in the Singapore-specific section below.
- Terminal Growth Rate: Set the DPU growth rate you expect the REIT to sustain indefinitely once it matures — this should always be lower than your required rate of return.
- Optional 2-stage model: Tick the box if you expect a temporary period of faster (or slower) growth — for example, right after a major acquisition — before the REIT settles into its long-run terminal growth rate.
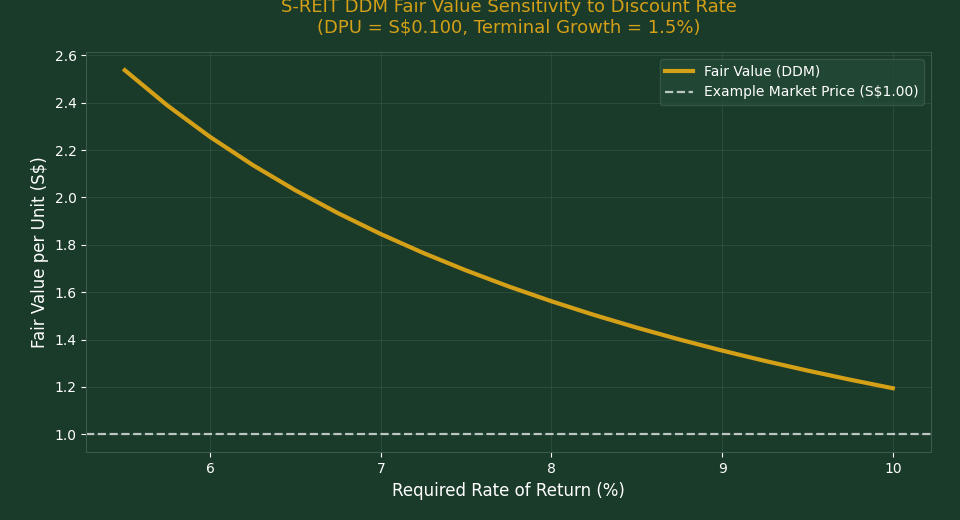
The calculator instantly recalculates fair value, margin of safety, upside/downside vs the current price, and the implied yield on fair value — plus a sensitivity chart showing how fair value moves as your discount rate assumption changes.
Pro tip: Run the same REIT through our S-REIT Yield vs Bond Spread Calculator too — if both point the same direction (undervalued or overvalued), you can be more confident in the read.
Contents — Click to Expand
- What Is the Dividend Discount Model?
- How the Gordon Growth & Two-Stage DDM Work: The Maths
- DDM vs P/NAV vs Yield: Which Should You Trust?
- Best Platforms to Buy Singapore REITs
- Choosing a Required Rate of Return for S-REITs
- Using Fair Value in a Passive Income / Retirement Strategy
- Frequently Asked Questions
What Is the Dividend Discount Model?
The Dividend Discount Model values a security as the sum of all its future dividends (or distributions), discounted back to today’s dollars at a required rate of return. The logic: a dollar of DPU you receive next year is worth less to you than a dollar today, because you could have invested today’s dollar elsewhere and earned a return on it. The further out a distribution is, and the higher your required return, the more its value shrinks when discounted back to the present. For a REIT expected to keep distributing indefinitely at a roughly constant growth rate, the model collapses into a simple formula — the Gordon Growth Model — which this calculator uses as its foundation, with an optional two-stage extension for REITs going through a temporary growth phase.
How the Gordon Growth & Two-Stage DDM Work: The Maths
The single-stage Gordon Growth formula is: Fair Value = D₁ ÷ (r − g), where D₁ is next year’s expected DPU, r is your required rate of return, and g is the long-run (terminal) growth rate. For example, a REIT paying S$0.100 DPU today, growing distributions at 1.5% a year forever, discounted at a 7.5% required return, is worth approximately S$0.10 × 1.015 ÷ (0.075 − 0.015) ≈ S$1.69 per unit. If it trades below that, it screens as undervalued on this model; above it, overvalued. The two-stage version (available as a toggle in the calculator above) first discounts a run of higher- or lower-growth years individually, then applies the Gordon Growth formula to everything after that as a “terminal value,” which is itself discounted back to today. This better reflects REITs that just completed a large acquisition or AEI and are expected to grow faster than their long-run trend for a few years before settling down. One structural rule the model enforces: your required rate of return must always exceed your terminal growth rate, or the denominator turns zero or negative and the “fair value” becomes meaningless (or infinite) — the calculator will flag this for you.
DDM vs P/NAV vs Yield: Which Should You Trust?
| Method | What It Measures | Best For |
|---|---|---|
| Distribution Yield | Cash return relative to price, today | Quick income screening, T-Bill/SGS spread comparison |
| P/NAV | Price relative to underlying property book value | Asset-backed valuation, cap-rate-driven REITs |
| Dividend Discount Model | Present value of all future distributions | Mature REITs with a consistent DPU growth trend |
None of these is definitively “correct” — they answer different questions. DDM is most reliable for large, diversified, mature S-REITs with several years of stable DPU history (think the retail, industrial and diversified heavyweights); it’s far shakier for newly-listed REITs, development-heavy trusts, or anything with a lumpy, unpredictable payout history, where a small change in your growth assumption swings the fair value wildly. Cross-check with our P/NAV Calculator before drawing a conclusion from DDM alone.
Best Platforms to Buy Singapore REITs
Once you’ve run the numbers, you’ll need a brokerage or robo-advisor to actually buy the units. Local full-service brokers (DBS Vickers, POEMS, UOB Kay Hian) give you direct SGX access and CDP-registered holdings, while robo-advisors and online brokers such as Endowus, Syfe and FSMOne offer lower-cost access to REIT-focused unit trusts and ETFs (such as the CSOP iEdge S-REIT Leaders Index ETF) if you’d rather diversify across the sector than pick individual names. If you do prefer single-REIT positions, compare brokerage commission structures carefully — a REIT bought for its 6–7% yield can see a meaningful chunk of one year’s distribution eaten up by high per-trade fees on small lot sizes.
Choosing a Required Rate of Return for S-REITs
Your required rate of return should reflect (a) the risk-free rate available in Singapore, and (b) the extra return you demand for taking on REIT-specific risk. As at July 2026, the Singapore 10-year government bond (SGS) yield is around 2.2–2.3%, with the July 2026 Singapore Savings Bond tranche’s 10-year average yield sitting near 2.1%. On top of that risk-free anchor, S-REITs typically warrant an equity risk premium of roughly 4–7 percentage points, depending on gearing, sector, and geography — putting most large, diversified, Singapore-focused S-REITs in a 6.5–8% required-return range, and smaller, higher-geared or overseas-heavy REITs closer to 8.5–10%. MAS’s 50% aggregate leverage cap on REITs is a useful sanity check when judging where a specific REIT should sit on that spectrum — a REIT running close to the cap generally deserves a higher discount rate than one running comfortably below it. Use our S-REIT Gearing Ratio & ICR Calculator to check where a REIT sits before settling on your rate.
Using Fair Value in a Passive Income Strategy for Retirement
DDM fair value is most useful as a discipline check on a passive-income S-REIT portfolio, not a precise price target to trade around. If you’re building a retirement income sleeve out of S-REITs, running each holding through this calculator periodically helps you spot when a position has run well ahead of what its own distribution growth can justify — a signal to trim, redeploy the yield elsewhere, or simply hold with eyes open rather than reflexively topping up on every dip. Pair this with our Retirement Planning Calculator to see how a REIT sleeve’s distributions fit into a broader retirement income plan, and see our Passive Income Singapore guide for how S-REITs typically slot alongside CPF LIFE, SRS and dividend stocks in a diversified income mix.
Frequently Asked Questions
What is a good discount rate to use for a Singapore REIT DDM calculation?
Most large, diversified S-REITs are commonly valued at a required rate of return of 6.5–8%, anchored to the ~2.2–2.3% Singapore 10-year government bond yield plus a 4–7 percentage point equity risk premium. Smaller, higher-geared or overseas-concentrated REITs typically warrant a higher rate, closer to 8.5–10%.
Is the Dividend Discount Model a good approach for valuing S-REITs in Singapore?
It’s a genuinely useful complement to yield and P/NAV analysis, especially for mature, stable-payout REITs, but it’s highly sensitive to your growth and discount rate assumptions. Small changes in either input can swing the estimated fair value substantially, so treat the output as a range-finding tool rather than a precise price target.
How much is a REIT worth if it pays 10 cents DPU and grows 1.5% a year forever?
Using the single-stage Gordon Growth Model at a 7.5% required rate of return: Fair Value = (S$0.10 × 1.015) ÷ (0.075 − 0.015) ≈ S$1.69 per unit. Try the calculator above with your own DPU, growth and discount rate assumptions for any specific REIT.
What is the difference between the single-stage and two-stage Dividend Discount Model?
The single-stage model assumes one constant growth rate forever. The two-stage model lets you model a temporary period of faster or slower growth — for example, right after a large acquisition — before the REIT settles into a lower, sustainable terminal growth rate for the rest of its life.
How much of my portfolio should I allocate to S-REITs in Singapore?
There’s no universal answer, but many Singapore retail investors targeting passive income use S-REITs as one sleeve alongside CPF LIFE, SRS-held funds and dividend stocks — commonly in the 15–30% of investable assets range, adjusted for your income needs, risk tolerance and time horizon. See our Retirement Planning Calculator to model this against your own goals.
Which Singapore platform is best for buying S-REITs or REIT ETFs?
Local brokers like DBS Vickers, POEMS and UOB Kay Hian give direct SGX access to individual REITs. If you’d rather diversify across the sector at lower cost, robo-advisors and online brokers such as Endowus, Syfe and FSMOne offer access to REIT-focused unit trusts and ETFs.
Can I hold S-REITs through my SRS account in Singapore?
Yes — SRS funds can be used to buy SGX-listed S-REITs directly, or REIT-focused unit trusts and ETFs through SRS-enabled brokerages and robo-advisors, which lets you defer tax on the contribution while your distributions compound inside the account.
What discount rate and growth rate should I use in this calculator for Singapore REITs?
As a starting point, anchor your discount rate to the current ~2.2–2.3% 10-year SGS yield plus a 4–7 percentage point risk premium (higher for smaller or higher-geared REITs), and set your terminal growth rate conservatively — typically 0–2% for most mature S-REITs — since assuming perpetual high growth will materially overstate fair value.
How does S-REIT valuation using DDM affect my retirement planning in Singapore?
Knowing whether your REIT holdings are trading above or below their DDM-estimated fair value helps you decide when to add, hold or trim positions as part of a broader retirement income plan — overpaying for distributions reduces your effective long-run yield, which matters more the closer you are to relying on that income.
Turn Fair Value Into a Full Income Plan
Fair value is one input into a bigger retirement picture. Use our free tools and referral bonuses to put your knowledge into action.