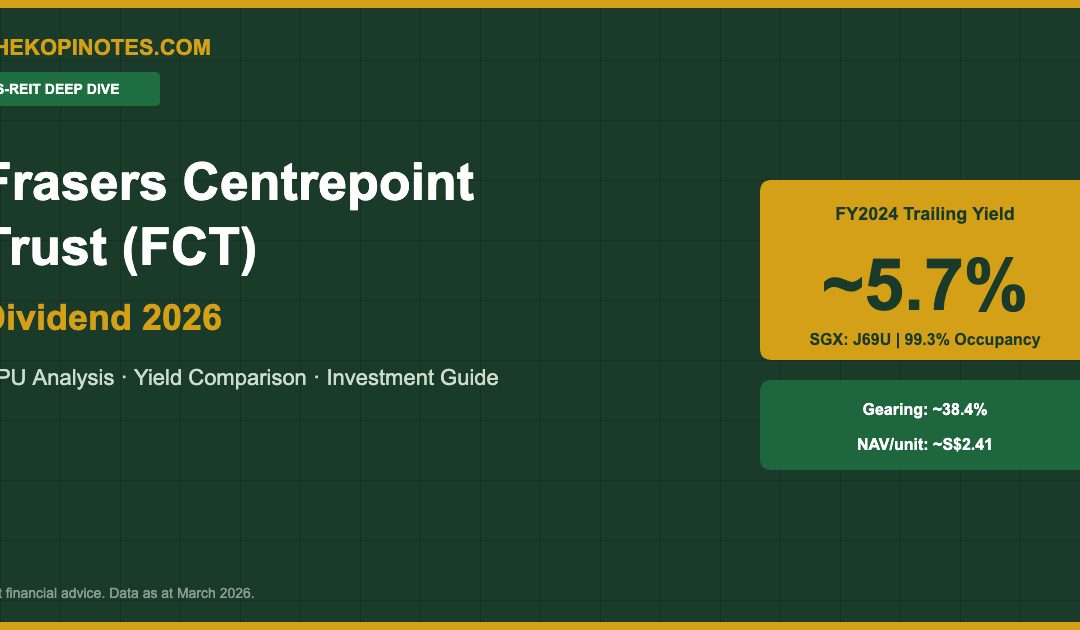
Frasers Centrepoint Trust (SGX: J69U) is Singapore’s largest suburban retail REIT by portfolio count, owning heartland malls that serve everyday Singaporeans across nine neighbourhoods — from Causeway Point in Woodlands to White Sands in Pasir Ris. With a portfolio occupancy rate of approximately 99.3% as at FY2024, FCT has quietly positioned itself as one of the most defensive retail REIT plays on the SGX.
As at early March 2026, FCT’s trailing distribution yield stands at approximately 5.7%, based on FY2024 DPU of ~12.006 cents per unit and a unit price around S$2.10. That may not be the highest yield on the SGX, but when you factor in occupancy resilience, a robust sponsor in Frasers Property, and limited overseas exposure, FCT’s risk-adjusted return profile becomes markedly more attractive than many higher-yielding peers.
This guide provides a detailed analysis of FCT’s dividend track record, yield versus S-REIT peers, financial health metrics, sector outlook for Singapore suburban retail in 2026, and a frank verdict on whether FCT belongs in your income portfolio. This article is for informational purposes only and does not constitute financial advice. Data is sourced from publicly available SGX announcements and company filings as at March 2026. Consult a MAS-licensed financial adviser before making investment decisions.
Table of Contents
What Is Frasers Centrepoint Trust?
Frasers Centrepoint Trust is a Singapore-focused retail REIT that was listed on the SGX in 2006. Sponsored by Frasers Property Limited (SGX: TQ5), FCT owns and operates a portfolio of nine suburban retail malls in Singapore, with a combined net lettable area (NLA) of approximately 2.5 million square feet. All properties are within the MRT network catchment area, giving them strong and stable footfall from commuters and residents alike.
FCT’s portfolio as at FY2024 (financial year ended 30 September 2024) comprises the following key assets:
- Causeway Point (Woodlands) — FCT’s flagship and largest asset, ~560,000 sqft NLA
- Northpoint City North Wing (Yishun) — integrated with MRT and bus interchange
- Waterway Point (Punggol) — 50% stake, integrated mixed-use development
- White Sands (Pasir Ris) — East Singapore heartland mall
- Tampines 1 (Tampines) — complementary to Century Square
- Century Square (Tampines) — repositioned retail and F&B hub
- Tiong Bahru Plaza (Tiong Bahru) — mature HDB estate neighbourhood anchor
- Hougang Mall (Hougang) — North-East suburban community mall
FCT also holds a 24.82% stake in PGIM Real Estate AsiaRetail Fund Limited (ARF), providing exposure to additional Singapore retail assets. The REIT’s manager is Frasers Centrepoint Asset Management Ltd., a wholly owned subsidiary of Frasers Property — providing a strong sponsor pipeline for future acquisitions.
If you’re building a diversified S-REIT portfolio, check out our guide on the best S-REITs in Singapore for 2026, which puts FCT in context alongside industrial, healthcare, and commercial peers.
FCT Dividend History & DPU Analysis
FCT distributes income to unitholders on a semi-annual basis, typically in March (H1: October–March) and September (H2: April–September). Below is FCT’s DPU track record based on SGX announcements:
| Financial Year | H1 DPU (¢) | H2 DPU (¢) | Full Year DPU (¢) | YoY Change |
|---|---|---|---|---|
| FY2021 (ended Sep 2021) | 5.47 | 6.09 | 11.56 | +8.4% |
| FY2022 (ended Sep 2022) | 6.19 | 6.11 | 12.30 | +6.4% |
| FY2023 (ended Sep 2023) | 6.16 | 6.14 | 12.30 | 0.0% |
| FY2024 (ended Sep 2024) | 6.07 | 5.94 | 12.01 | −2.4% |
| FY2025 H1 (ended Mar 2025) | ~5.85* | TBA | TBA | TBA |
*FY2025 H1 DPU is an estimate based on analyst consensus. Verify via SGX announcements. Data as at March 2026.
Yield Calculation
The trailing distribution yield is calculated as:
Trailing Yield = (Full Year DPU ÷ Current Unit Price) × 100
Example: 12.01 cents ÷ S$2.10 × 100 = 5.72%
FCT’s DPU has been remarkably stable — declining only modestly in FY2024 (−2.4%) due to higher financing costs as rate hedges rolled off into a higher SORA environment. This is not a structural deterioration: FCT’s net property income (NPI) remained broadly flat, with the DPU drag attributable to interest expense rather than operational underperformance. As SORA moderates through 2025–2026, FCT’s distributable income is expected to recover incrementally.
For a passive route to Singapore retail REIT exposure, see our Singapore S-REIT ETF guide.

S-REIT Yield Comparison Table 2026
How does FCT stack up against other S-REITs? The table below compares FCT against nine peer REITs across different sectors using trailing DPU, unit price, and gearing data as at early March 2026. All figures are approximate and sourced from publicly available SGX filings.
| REIT | SGX Code | Sector | Trailing DPU (¢) | Unit Price (S$) | Yield (%) | Gearing (%) |
|---|---|---|---|---|---|---|
| Frasers Centrepoint Trust ★ | J69U | SG Suburban Retail | 12.01 | ~2.10 | ~5.7% | ~38.4% |
| CapitaLand Integrated Commercial Trust | C38U | Commercial / Retail | 10.80 | ~1.99 | ~5.4% | ~40.4% |
| Suntec REIT | T82U | Commercial / Convention | 8.80 | ~1.35 | ~6.5% | ~44.2% |
| Mapletree Pan Asia Commercial Trust | N2IU | Commercial / Retail (Pan-Asia) | 8.04 | ~1.26 | ~6.4% | ~40.5% |
| Lendlease Global Commercial REIT | JYEU | Retail / Mixed-Use | 3.39 | ~0.48 | ~7.1% | ~39.3% |
| Starhill Global REIT | P40U | Retail / Hospitality | 3.32 | ~0.43 | ~7.7% | ~36.1% |
| Keppel REIT | K71U | Commercial Office | 5.72 | ~0.95 | ~6.0% | ~42.8% |
| CapitaLand Ascendas REIT | A17U | Industrial / Logistics | 15.01 | ~2.72 | ~5.5% | ~38.3% |
| Mapletree Logistics Trust | M44U | Logistics (Pan-Asia) | 7.58 | ~1.28 | ~5.9% | ~40.2% |
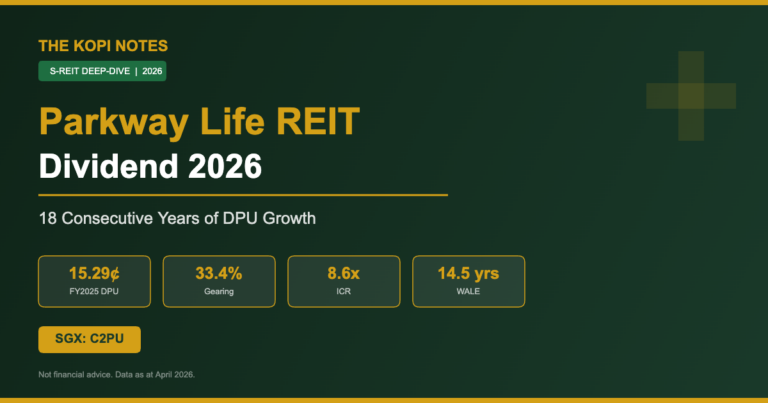
| Parkway Life REIT | C2PU | Healthcare | 14.83 | ~3.94 | ~3.8% | ~35.8% |
★ = Article subject. All figures approximate based on latest SGX filings and market prices as at early March 2026. MAS Property Fund Appendix (PFA) mandates a maximum gearing of 50% (or 55% with ICR ≥ 2.5x). Verify current data on SGX.
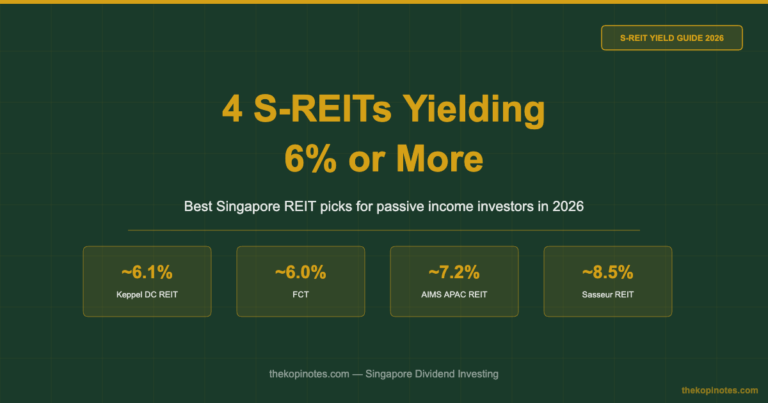
FCT’s ~5.7% yield sits in the middle of the pack — below higher-risk plays like Starhill (7.7%) and Suntec (6.5%), but above defensive Parkway Life (3.8%). The key differentiator is FCT’s near-perfect occupancy and Singapore-only exposure, eliminating forex risk entirely. Explore passive options via our S-REIT ETF guide or Syfe referral code for portfolio products.

FCT Financial Health: Gearing, ICR & NAV
For any S-REIT investor, understanding a REIT’s balance sheet is as important as the yield. Three metrics matter most: gearing ratio, interest coverage ratio (ICR), and net asset value (NAV) per unit.
Gearing Ratio
FCT’s aggregate leverage (gearing) as at FY2024 stood at approximately 38.4%. Under MAS’s Property Fund Appendix (PFA), S-REITs are subject to a maximum gearing limit of 50%, extendable to 55% if the REIT maintains an ICR of at least 2.5x. FCT’s gearing of ~38.4% provides approximately S$700M–S$800M of debt headroom before approaching the 45% prudential threshold many institutional investors apply — a meaningful buffer for acquisitions or market stress.
Interest Coverage Ratio (ICR)
FCT’s ICR for FY2024 was approximately 3.2x — comfortably above the MAS minimum of 2.5x required to access the 55% gearing limit. A higher ICR signals that FCT generates strong enough NPI to comfortably service its interest expenses. For context, REITs with ICRs below 2.0x are typically viewed with concern by institutional analysts.
NAV Per Unit & Price-to-Book
FCT’s NAV per unit as at 30 September 2024 was approximately S$2.41. At a unit price of ~S$2.10, FCT trades at a P/B ratio of approximately 0.87x — a discount to NAV. Historically, FCT has traded at or above book value during low-rate periods, suggesting potential capital upside as SORA normalises.
Key Balance Sheet Metrics (as at FY2024, ~30 Sep 2024):
Gearing: ~38.4% | ICR: ~3.2x | NAV/unit: ~S$2.41 | P/B: ~0.87x | Fixed-rate debt: ~75%+
FCT had approximately 75%+ of its debt on fixed-rate terms as at FY2024, providing meaningful protection against SORA volatility. As hedges mature and are refinanced at potentially lower SORA rates through 2025–2026, FCT’s financing cost per unit should moderate — supporting DPU stabilisation and potential recovery.
Considering using CPF to invest in FCT? Our CPF investment strategy guide covers eligibility and the mechanics of investing CPF-OA funds in SGX-listed REITs.
Singapore Suburban Retail Outlook 2026
FCT’s investment thesis is inextricably linked to the health of Singapore’s suburban retail sector. Here’s the macro and sector-level picture as at Q1 2026.
SORA Trajectory & Financing Cost Relief
The 3-month compounded SORA peaked at around 3.7–3.8% in late 2023 and has moderated into the 2.8–3.2% range through early 2026, broadly tracking the US Federal Reserve’s rate normalisation cycle. For FCT specifically, the ~75% fixed-rate hedging means this cycle has been somewhat insulated, but as hedges roll off through FY2025–2026, FCT stands to benefit from refinancing at more favourable rates. Lower financing costs translate directly to higher distributable income per unit.
Singapore Consumer Spending & Heartland Retail Resilience
Singapore’s resident employment and wage growth remained robust through FY2024, with the Ministry of Manpower reporting median monthly income growth of approximately 4–6% year-on-year. This directly supports footfall and tenant sales at FCT’s heartland malls. Unlike Grade-A CBD retail (which is more sensitive to global white-collar employment trends), suburban malls serving essential categories like supermarkets, F&B, healthcare and household services are structurally more resilient to economic cycles.
FCT’s portfolio skews heavily toward essential and necessity retail: NTUC FairPrice anchors Causeway Point, multiple malls carry established pharmacies, childcare centres, and enrichment providers. This tenant mix is far less vulnerable to e-commerce disruption than fashion or electronics retail — and FCT’s ~99.3% occupancy as at FY2024 validates this thesis.
New Supply Risk: Limited in Heartland
In Singapore’s suburban heartlands, URA planning restrictions and limited land parcels constrain new mall development near existing MRT catchments. FCT’s malls are deeply embedded in HDB towns with captive retail catchments — most are the sole or dominant mall serving their residential population. This structural scarcity provides pricing power at lease renewal, supporting positive rental reversion over time.
Asset Enhancement Initiatives (AEIs)
FCT has a track record of disciplined AEI programmes that refresh malls and drive rental reversion. Century Square and Tampines 1 have both undergone significant AEI work, resulting in improved tenant mix and higher NPI. Northpoint City North Wing’s integrated positioning with Yishun MRT-bus interchange continues to drive strong visitor throughput year-round.

FCT Pros & Cons
| Pros | Cons / Risks |
|---|---|
| Near-perfect portfolio occupancy (~99.3%) — highest among Singapore retail REITs | DPU declined modestly in FY2024 (−2.4%) due to higher financing costs |
| 100% Singapore-focused portfolio — zero forex risk for SGD investors | Unit price trading below NAV (~0.87x P/B) reflects rate-sensitive sentiment overhang |
| Conservative gearing (~38.4%) well below MAS 50% limit, with ~S$700–800M debt headroom | Suburban retail concentrated in Singapore — limited geographic diversification |
| Strong Frasers Property sponsor pipeline for future acquisition opportunities | Lower yield (~5.7%) vs higher-risk retail peers (Starhill ~7.7%, Lendlease ~7.1%) |
| Essential retail tenant mix (supermarkets, healthcare, F&B) — highly e-commerce resilient | AEI-related disruptions can temporarily suppress tenant sales and footfall |
| SORA moderation tailwind — fixed-rate debt rollovers in FY2025–26 could reduce financing costs | Potential equity-raising risk if sponsor pipeline acquisitions require additional capital |
Is FCT Worth Buying in 2026? Our Verdict
FCT is not a yield-chase play. If you’re looking for the highest S-REIT distribution yield in 2026, you’ll find better options in Starhill Global, Suntec, or Lendlease — all of which offer 6.5–7.7%. But those come with higher gearing, more cyclical tenant mixes, and in some cases overseas exposure that introduces forex and regulatory risk.
FCT is, in our view, the benchmark defensive Singapore retail REIT — the kind of core holding that anchors a Singapore income portfolio rather than serving as a satellite high-yield position. Here’s the investment case in plain terms:
- You’re buying near-perfect occupancy in HDB heartland malls that Singaporeans use weekly — not just for discretionary purchases.
- You’re buying a REIT with gearing ~11–12 percentage points below the MAS limit, meaning the trust has capacity to grow without aggressive equity raising.
- You’re buying below book value (0.87x NAV) in a sector where FCT traded above 1.1x P/B during the low-rate era of 2019–2021, suggesting potential capital upside as rates normalise.
- The ~5.7% trailing yield is stable — FCT’s DPU is among the most consistent in the S-REIT universe, which matters enormously for retirees and CPF-IS investors prioritising income predictability.
Our take: FCT is a Buy for long-term Singapore income investors at current levels (~S$2.05–2.15), particularly for those using it as part of a CPF-IS or SRS strategy. We would revisit this view if gearing rises meaningfully above 42% or if Singapore’s resident employment outlook deteriorates significantly.
To model how FCT’s dividends fit into your retirement income plan, try our free Singapore retirement calculator. To buy FCT through a low-cost broker, check out our FSMOne referral code for potential account opening benefits.
Frequently Asked Questions
What is the current FCT dividend yield in 2026?
How often does FCT pay dividends?
Can I use CPF to buy Frasers Centrepoint Trust?
What is FCT's gearing and is it safe?
What malls does Frasers Centrepoint Trust own?
How has FCT's DPU trended over the past 4 years?
Is FCT a good long-term investment?
How does FCT compare to CICT (CapitaLand Integrated Commercial Trust)?
What is the FCT unit price today?
Where can I buy FCT shares in Singapore?
References
The following sources were referenced in compiling this article. All external links carry rel=”nofollow” in accordance with our editorial policy.
- SGX – Frasers Centrepoint Trust (J69U) Listing & Announcements
- Frasers Centrepoint Trust – Investor Relations (Annual Reports)
- MAS – REIT Regulatory Framework & Property Fund Appendix
- SingStat – Singapore Retail Trade Statistics
- MAS – Monthly Statistical Bulletin (SORA & Interest Rate Data)
Disclaimer: This article is for informational purposes only. The Kopi Notes is not a MAS-licensed financial adviser. All investment decisions should be made based on your own research and in consultation with a licensed financial adviser. Past DPU performance is not indicative of future distributions. Data as at March 2026.
This article was researched with the help of AI. While we strive to keep all information accurate and up to date, there may be errors. If you notice any discrepancies, please contact us.