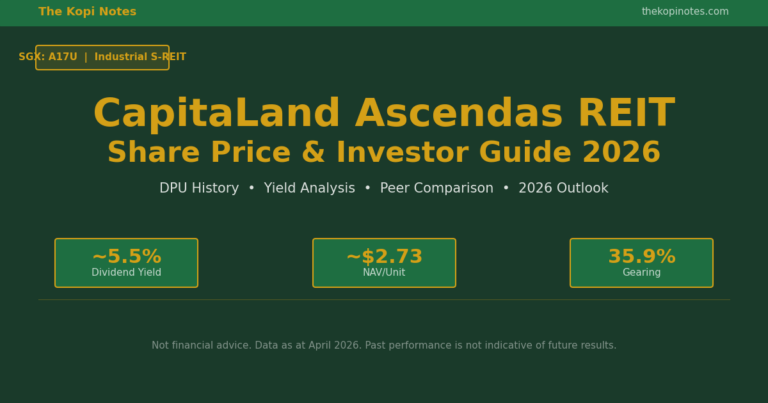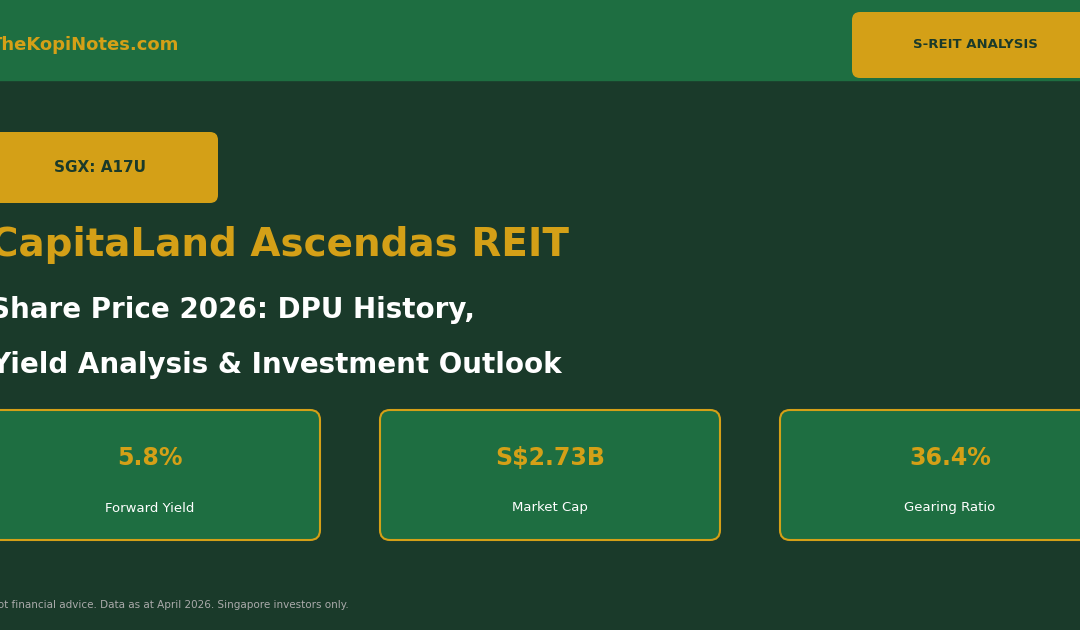
CapitaLand Ascendas REIT Share Price 2026: DPU History, Yield Analysis & Investment Outlook (SGX: A17U)
Singapore’s largest industrial REIT by market capitalisation, CapitaLand Ascendas REIT (SGX: A17U) continues to anchor diversified S-REIT portfolios in 2026. This guide breaks down CLAR’s share price drivers, DPU history, forward yield, gearing, and how it stacks up against industrial and logistics peers — so you can make an informed decision as a Singapore investor.
Not financial advice. Data as at April 2026. Always do your own due diligence before investing.
Table of Contents
Contents — Click to expand
- What is CapitaLand Ascendas REIT?
- CLAR Share Price Performance 2026
- DPU History & Distribution Track Record
- Yield Analysis: Is CLAR Worth It?
- Portfolio Overview: What Does CLAR Own?
- Gearing Ratio & Financial Health
- CLAR vs Industrial REIT Peers
- Can You Buy CLAR with CPF?
- How to Buy CLAR in Singapore
- Frequently Asked Questions
What is CapitaLand Ascendas REIT?
CapitaLand Ascendas REIT (SGX: A17U), commonly known as CLAR or “Ascendas REIT,” is Singapore’s first and largest listed business space and industrial REIT. Established in 2002 and listed on the Singapore Exchange, it is managed by CapitaLand Investment — one of Asia’s largest real estate investment managers.
As at April 2026, CLAR holds a portfolio of over 230 properties across Singapore, Australia, the United States, the United Kingdom, and Europe, with a total asset value exceeding S$17 billion. Property types include business & science parks, suburban offices, hi-spec industrial facilities, logistics & distribution centres, data centres, and light industrial/flatted factory buildings.
| Key Fact | Detail |
|---|---|
| SGX Ticker | A17U |
| REIT Type | Industrial / Business Parks / Data Centres |
| Manager | CapitaLand Ascendas REIT Management Ltd |
| Distribution Frequency | Semi-annual (H1 & H2) |
| No. of Properties | 230+ across 6 countries |
| Total Assets | ~S$17.5 billion (as at Dec 2025) |
| Listed Since | November 2002 |
| CPF Investment Scheme | Yes (CPF-OA eligible) |
CLAR Share Price Performance 2026
CLAR’s share price entered 2026 at approximately S$2.65, reflecting pressure from elevated global interest rates and cautious sentiment toward rate-sensitive assets. By April 2026, the unit price has traded in the S$2.55–S$2.80 range as investors weighed the impact of the US Federal Reserve’s rate trajectory and global tariff uncertainty.
| Period | Price Range (S$) | Key Driver |
|---|---|---|
| Jan 2026 | 2.60 – 2.72 | Rate cut expectations; moderate optimism |
| Feb 2026 | 2.58 – 2.75 | US CPI data; Fed guidance hawkish tone |
| Mar 2026 | 2.52 – 2.68 | Trump tariff announcements; risk-off selloff |
| Apr 2026 | 2.55 – 2.80 | Tariff pause relief; data centre demand tailwinds |
CLAR’s share price tends to be more resilient than retail or hospitality REITs during macro turbulence, owing to its diversified portfolio and long weighted average lease expiry (WALE) of approximately 3.8 years. Data centre assets — which account for roughly 9% of portfolio value — remain a structural growth driver as AI infrastructure buildout accelerates across Singapore and Australia.
For Singapore retail investors, CLAR’s share price history shows that it has generally held its NAV reasonably well, often trading at or near book value — unlike some S-REITs that have seen steep NAV discounts. As at April 2026, CLAR trades at roughly 0.9–1.0x Price-to-Book, which many value-oriented investors consider a reasonable entry zone.

DPU History & Distribution Track Record
CLAR distributes income to unitholders semi-annually — typically in July (for H1) and January (for H2). Its DPU track record demonstrates reasonable stability over the past six years, with only a modest dip in FY2020 reflecting COVID-related impacts before recovering strongly in FY2021.
| Financial Year | DPU (Singapore cents) | YoY Change | H1 DPU | H2 DPU |
|---|---|---|---|---|
| FY2019 | 15.76¢ | — | 7.82¢ | 7.94¢ |
| FY2020 | 14.14¢ | -10.3% | 6.87¢ | 7.27¢ |
| FY2021 | 15.82¢ | +11.9% | 7.72¢ | 8.10¢ |
| FY2022 | 15.21¢ | -3.9% | 7.69¢ | 7.52¢ |
| FY2023 | 15.43¢ | +1.4% | 7.72¢ | 7.71¢ |
| FY2024 | 15.058¢ | -2.4% | 7.52¢ | 7.538¢ |
| FY2025e | ~15.2¢ (est.) | +1.0% | TBC | TBC |
The FY2024 DPU dip to 15.058¢ reflected higher financing costs as CLAR’s average cost of debt rose alongside benchmark rates. However, management has maintained healthy payout ratios and consistent semi-annual distributions, which is a key reason CLAR remains a core holding in many Singapore dividend investors’ portfolios.
Looking at FY2025 estimates, most analysts expect a mild DPU recovery as refinancing pressures ease slightly and contributions from new acquisitions (particularly data centre developments in Singapore and Australia) begin flowing through.
Yield Analysis: Is CLAR Worth It?
At the current share price of approximately S$2.62 (as at April 2026) and an estimated FY2025 DPU of ~15.2¢, CLAR’s forward distribution yield works out to approximately 5.8%. That sits at the lower end of the S-REIT yield spectrum, which is typical for “blue-chip” or “quality” REITs that command a premium over smaller, more volatile peers.
| Share Price | DPU (FY2025e) | Forward Yield |
|---|---|---|
| S$2.50 | 15.2¢ | 6.08% |
| S$2.55 | 15.2¢ | 5.96% |
| S$2.62 | 15.2¢ | 5.80% (approx. current) |
| S$2.70 | 15.2¢ | 5.63% |
| S$2.80 | 15.2¢ | 5.43% |
For Singaporean investors comparing CLAR against the 10-year Singapore Government Securities (SGS) bond yield of approximately 3.0–3.2% (as at April 2026), CLAR’s yield spread of ~260bps represents reasonable compensation for the equity risk premium — particularly given CLAR’s diversified portfolio and institutional-quality assets.
You can use the S-REIT Yield vs SGS Bond Spread Calculator on this site to quickly compute CLAR’s current spread at any share price, and the REITs Dividend Yield Calculator to model your income from different lot sizes.

Portfolio Overview: What Does CLAR Own?
CLAR’s portfolio is deliberately diversified across geographies and asset sub-types, reducing concentration risk. Here is a snapshot of its portfolio composition as at December 2025:
| Geography | No. of Properties | % of Portfolio Value | Key Asset Types |
|---|---|---|---|
| Singapore | ~90 | ~47% | Business parks, hi-spec industrial, data centres, logistics |
| Australia | ~50 | ~20% | Logistics, suburban offices, data centres |
| United States | ~35 | ~15% | Business parks (life sciences, tech), R&D offices |
| United Kingdom / Europe | ~55 | ~18% | Hi-tech logistics, urban distribution centres |
Singapore assets remain the bedrock of the portfolio, providing stable, SGD-denominated income. Overseas assets provide diversification but also introduce foreign exchange (FX) risk — CLAR hedges a portion of its overseas distributions to mitigate this.
Data centres have emerged as a major growth theme within CLAR’s portfolio. Singapore’s position as Southeast Asia’s premier data centre hub — supported by the Infocomm Media Development Authority’s (IMDA) push for digital infrastructure — means CLAR’s existing data centre assets and development pipeline are well-positioned to capture rising demand from cloud providers and AI workloads.
Top 10 Largest Properties (by Valuation)
CLAR’s top assets include Aperia Mall and Galaxis in Singapore, logistics assets in Sydney and Melbourne, and US life science facilities. No single property accounts for more than 3–4% of total portfolio value, demonstrating strong asset-level diversification.
Gearing Ratio & Financial Health
As at December 2025, CLAR’s aggregate leverage (gearing ratio) stands at approximately 36.4%, comfortably below MAS’s 50% regulatory limit for Singapore REITs. This provides meaningful debt headroom for acquisitions or development activity without needing to raise equity via a dilutive rights issue.
| Metric | Value (Dec 2025) | Industry Benchmark |
|---|---|---|
| Aggregate Leverage | 36.4% | <45% = comfortable; >40% = watch |
| Interest Coverage Ratio (ICR) | ~3.6x | >2.5x required by MAS |
| Avg. Cost of Debt | ~3.6% p.a. | — |
| % Fixed Rate Debt | ~79% | Higher = more protected from rate rises |
| Weighted Avg. Debt Maturity | ~3.6 years | Longer = lower refinancing risk |
With 79% of debt on fixed rates, CLAR is relatively insulated from further rate increases in the near term. Average cost of debt at 3.6% is manageable given the portfolio’s income generation capacity. As older debt facilities mature and are refinanced at potentially lower rates in 2026–2027 (assuming the Fed does cut rates), there could be a modest tailwind to DPU.
You can model CLAR’s gearing position against the MAS thresholds using the S-REIT Gearing Ratio & ICR Calculator — a free tool on this site.
CLAR vs Industrial REIT Peers: How Does It Compare?
Industrial and logistics REITs are a popular sub-sector for Singapore investors seeking steady income with moderate risk. Here is how CLAR compares against key S-REIT peers as at April 2026:
| REIT (SGX Code) | Forward Yield | Gearing | WALE (yrs) | Geography | Focus |
|---|---|---|---|---|---|
| CLAR (A17U) | 5.8% | 36.4% | 3.8 | SG/AU/US/EU | Industrial, Data Centres, Business Parks |
| Mapletree Logistics Trust (M44U) | 7.2% | 39.2% | 3.3 | Pan-Asia | Logistics & warehousing |
| Mapletree Industrial Trust (ME8U) | 5.9% | 38.1% | 4.1 | SG/US | Hi-tech industrial, flatted factories, data centres |
| Keppel DC REIT (AJBU) | 4.8% | 35.2% | 7.0 | Global | Pure-play data centres |
| ESR-Logos REIT (J91U) | 8.1% | 41.3% | 3.1 | SG/AU/India | Logistics, light industrial |
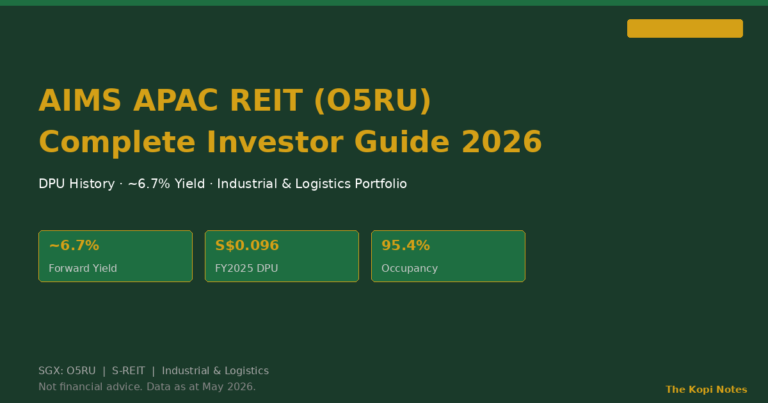
| AIMS APAC REIT (O5RU) | 7.5% | 33.8% | 3.5 | SG/AU | Industrial, logistics |
CLAR’s 5.8% yield is below the sector average, but this reflects its quality premium: the portfolio is larger, more diversified, and operationally superior. Investors who prioritise capital preservation and long-term stability often accept a lower yield for CLAR’s defensive characteristics.
By contrast, ESR-Logos REIT and AIMS APAC REIT offer higher yields (7–8%), but with smaller, less diversified portfolios and slightly higher gearing — implying more risk. For a fuller comparison of all S-REIT yields, see the Best S-REITs in Singapore 2026 guide.
Can You Buy CLAR with CPF OA?
Yes. CapitaLand Ascendas REIT is approved under the CPF Investment Scheme (CPFIS-OA), which means Singapore citizens and PRs can use up to 35% of their investible CPF OA savings to purchase CLAR units through an approved CPF Investment Account.
However, before investing CPF OA funds in any REIT, you should carefully consider:
- The CPF OA guaranteed interest rate of 2.5% p.a. — your REIT investment needs to outperform this on a risk-adjusted basis over time.
- REIT unit prices can and do fall. Capital loss from a lower unit price could offset years of DPU income.
- CLAR distributions received in your CPF Investment Account will be added back to your OA, not paid out in cash.
Read our full guide on CPF investment strategy and use the retirement planning calculator to model how REIT investing fits into your overall CPF retirement strategy.
How to Buy CLAR in Singapore
CLAR (SGX: A17U) is bought and sold like any ordinary share on the Singapore Exchange (SGX). You need a brokerage account with SGX access. Each standard lot is 1,000 units. Popular platforms among Singapore retail investors include:
- Endowus — for CPF and SRS investing; access CLAR via their fund platform. Get S$20 cash via our Endowus referral code.
- Syfe — Syfe Trade allows commission-free SGX trading, including REITs like CLAR. Check our Syfe referral code for bonus.
- FSMOne — Good for regular savings plans and SGX stocks. Our FSMOne referral code gives you fee waivers.
Brokerage commissions for SGX trades typically range from 0.08% to 0.28% per trade depending on your platform, minimum charges apply. Always compare before trading.
Frequently Asked Questions: CapitaLand Ascendas REIT
What is CapitaLand Ascendas REIT's ticker symbol?
What is CLAR's current distribution yield?
How often does CLAR pay distributions?
Is CapitaLand Ascendas REIT a good investment in 2026?
What is CLAR's gearing ratio?
Can I buy CLAR using CPF OA money?
What is CapitaLand Ascendas REIT's NAV per unit?
Useful Tools & Related Guides
- REITs Dividend Yield Calculator — compute exact yield from any DPU + share price
- S-REIT Yield vs SGS Bond Spread Calculator — model the yield spread vs risk-free rate
- S-REIT Gearing Ratio & ICR Calculator
- Best S-REITs in Singapore 2026 — full ranking by yield, gearing & quality
- Singapore REIT ETF Guide — prefer diversified exposure vs single REIT?
- CPF Investment Strategy Guide
This article was researched with the help of AI. While we strive to keep all information accurate and up to date, there may be errors. If you notice any discrepancies, please contact us.