Mapletree Industrial Trust (ME8U) 2H2026 DPU Outlook: Will MIT Sustain 12.71c Distribution?
S-REIT Analysis | SGX: ME8U | Updated September 2026
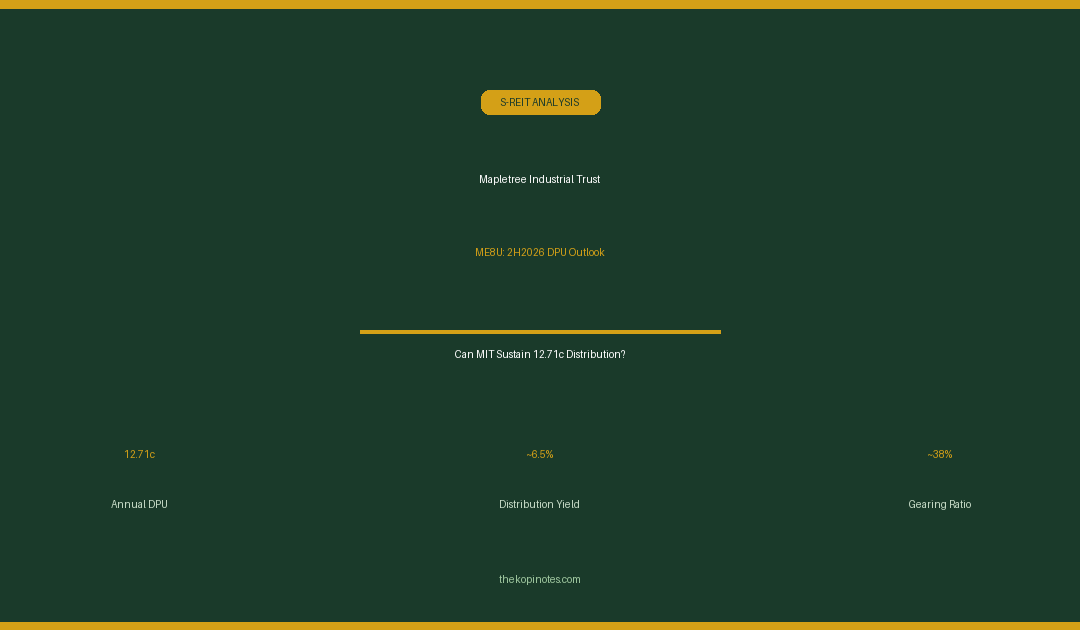
Mapletree Industrial Trust (SGX: ME8U) paid a full-year DPU of 12.71 Singapore cents in FY2025/26, delivering a distribution yield of approximately 6.4% at current share prices near S$1.98. MIT is Singapore’s second-largest industrial S-REIT by market capitalisation, with a portfolio spanning data centres, flatted factories, hi-tech buildings, and business parks across Singapore and North America. The key question for 2H2026: can MIT hold its 12.71c distribution as new data centre supply enters the market and interest costs remain elevated at ~4.2% average all-in cost?
Not financial advice. All figures are for educational reference only. Data as at September 2026 unless noted.
Table of Contents
Contents
- MIT Overview: What Is Mapletree Industrial Trust?
- MIT DPU History & Distribution Track Record
- Portfolio Breakdown: Data Centres vs Industrial Assets
- Key Financial Metrics: Gearing, NAV & Occupancy
- 2H2026 DPU Outlook: Can MIT Hold 12.71c?
- MIT Share Price Analysis & Fair Value
- MIT vs CapitaLand Ascendas REIT: Which Industrial REIT Wins?
- Should You Buy Mapletree Industrial Trust in 2026?
- FAQ
MIT Overview: What Is Mapletree Industrial Trust?
Mapletree Industrial Trust (ME8U) is a Singapore-listed real estate investment trust managed by Mapletree Industrial Trust Management Ltd, a wholly owned subsidiary of Mapletree Investments Pte Ltd (itself a GLC under Temasek Holdings). MIT listed on the SGX-ST in October 2010.
MIT’s investment mandate focuses on income-producing real estate used primarily for industrial purposes in Singapore, with a strategic allocation to data centres globally through its joint venture with Mapletree Investments. As at 1H FY2025/26 (September 2025), MIT’s portfolio comprised approximately 141 properties with a total asset value of around S$8.9 billion.
MIT at a Glance (FY2025/26)
| Metric | Value |
|---|---|
| SGX Ticker | ME8U |
| Full-Year DPU (FY2025/26) | 12.71 Singapore cents |
| Distribution Yield (at S$1.98) | ~6.4% |
| Total Assets | ~S$8.9 billion |
| No. of Properties | 141 |
| Gearing Ratio | ~38.3% |
| Average Debt Cost (annualised) | ~4.2% |
| % Debt Fixed Rate | ~78% |
| Weighted Average Lease Expiry (WALE) | ~3.8 years (by NLA) |
Source: MIT 1H FY2025/26 results presentation and annual report. All data as at September 2026.
MIT DPU History & Distribution Track Record
MIT has maintained a broadly stable-to-growing distribution per unit since its listing in 2010. The REIT’s DPU trajectory reflects its strategic pivot from pure industrial properties toward higher-yielding data centres, which now make up more than half of its portfolio by asset value.
| Financial Year | Full-Year DPU (cents) | YoY Change |
|---|---|---|
| FY2021/22 | 13.36c | +9.2% |
| FY2022/23 | 13.77c | +3.1% |
| FY2023/24 | 13.52c | -1.8% |
| FY2024/25 | 12.90c | -4.6% |
| FY2025/26 | 12.71c | -1.5% |
The DPU trend shows a mild decline from the FY2022/23 peak, primarily driven by higher interest costs and the dilutive effect of equity fund-raising for data centre acquisitions in North America. Despite this, MIT’s 6.4% yield at current prices remains competitive versus Singapore 10-year government bond yields of around 3.0–3.2%.
MIT pays distributions semi-annually: typically a 1H distribution in November and a 2H distribution in May. For FY2025/26, MIT declared 1H DPU of 6.34c (paid November 2025) and 2H DPU of 6.37c (paid May 2026).
For investors tracking the Mapletree Industrial Trust share price and its historical DPU pattern, the key watch-point for 2H FY2026/27 (to be declared in late 2026) is whether MIT can stabilise its distribution after two consecutive years of cuts.
Portfolio Breakdown: Data Centres vs Industrial Assets
MIT’s portfolio is split between Singapore-based industrial properties and overseas data centres. The data centre segment (via the Mapletree US & EU Data Centre JV with Mapletree Investments) now contributes the majority of the REIT’s asset value.
| Segment | % of Total Assets | Key Characteristics |
|---|---|---|
| Data Centres (North America + Europe) | ~57% | Long leases, hyperscaler tenants, USD/EUR denominated income |
| Hi-Tech Buildings (Singapore) | ~21% | Includes Mapletree Business City I & II, Telok Blangah (built-to-suit) |
| Flatted Factories (Singapore) | ~12% | JTC cluster estates, shorter leases, renewal risk |
| Business Park Buildings (Singapore) | ~7% | Science Park I & II, International Business Park |
| Light Industrial Buildings (Singapore) | ~3% | Stacked-up factories, lower-margin segment |
Key Occupancy Rates (1H FY2025/26)
Overall portfolio occupancy stands at approximately 92.4%, with data centres at near-full occupancy (~99%) while flatted factories and business park properties face softer demand (~88–90%). The high data centre occupancy reflects the structural tailwind from AI infrastructure buildout and hyperscaler demand in North America.
MIT’s top tenant by gross revenue contribution includes blue-chip names such as HP Inc., Dell Technologies, and multiple hyperscalers in its US data centre JV, providing strong income visibility and reducing single-tenant default risk.
Key Financial Metrics: Gearing, NAV & Occupancy
MIT’s balance sheet is moderately geared at 38.3%, well within MAS’s 50% regulatory ceiling. However, its cost of debt at ~4.2% is a meaningful headwind to distributable income, particularly as older fixed-rate hedges roll off at higher rates.
MIT’s NAV per unit stands at approximately S$1.74 as at the end of FY2025/26. At a current share price of ~S$1.98, MIT trades at a 14% premium to NAV — reflecting market confidence in the data centre growth story but limiting upside from a pure asset-value perspective. In comparison, CapitaLand Ascendas REIT (A17U) trades closer to 1.0x NAV. Investors looking to buy MIT on a discount-to-NAV basis may find the entry point less compelling today versus other S-REITs.
On the debt maturity profile, MIT has well-staggered refinancing across 2026–2030 with no single year accounting for more than 25% of total debt — reducing refinancing cliff risk. Approximately 78% of debt is hedged at fixed rates, providing near-term DPU stability even if floating rates stay elevated.
For context, investors seeking the best S-REITs in Singapore 2026 often evaluate MIT against peers like CapitaLand Ascendas REIT and Keppel DC REIT on a gearing-adjusted yield basis. MIT’s risk-adjusted profile sits between these two: more diversified than a pure-play data centre REIT (Keppel DC REIT), but more tech-tilted than a broad industrial REIT.
2H2026 DPU Outlook: Can MIT Hold 12.71c?
MIT’s 2H FY2026/27 DPU (covering the period April–September 2026, to be declared around November 2026) faces two opposing forces:
Tailwinds:
- Data centre occupancy remains near full (99%) across the North America JV portfolio — AI infrastructure demand has not materially softened through 2026.
- The US Federal Reserve’s September 2026 FOMC meeting (17–18 September) may deliver a rate cut, which would reduce refinancing costs on floating-rate debt tranches and lift overall REIT sentiment.
- MIT’s 78% fixed-rate hedge ratio limits near-term income erosion even if rates stay elevated.
- Singapore’s industrial property market has shown resilience, with flatted factory rents stable at ~S$2.20–2.40/sq ft/month on renewal.
Headwinds:
- New data centre supply is entering the North America market through 2026–2028 — hyperscaler tenants have more negotiating leverage on renewal rates, which could compress renewal premiums for MIT’s JV assets.
- MIT’s legacy fixed-rate hedges are rolling off gradually; the mark-to-market replacement rate is approximately 50–80 basis points higher than the hedged rate, creating a slow-burn DPU drag through FY2026/27.
- MIT at 1.14x P/NAV has limited room for accretive equity fund-raising to grow distributable income via acquisitions — unlike peers trading at or near NAV.
- Foreign currency risk: ~57% of MIT’s assets generate USD/EUR income. A strengthening SGD reduces the SGD-equivalent distributable income from overseas properties.
Our assessment: MIT is likely to declare a 1H FY2026/27 DPU in the range of 6.20–6.40 cents (payable November 2026), implying a full-year annualised DPU of approximately 12.40–12.80 cents — broadly flat to the FY2025/26 level of 12.71c. A significant DPU cut (more than 10%) would require a major negative catalyst such as a sharp US recession or a hyperscaler non-renewal in the JV portfolio, neither of which appears imminent as at September 2026.
Investors focused on passive income in Singapore should note that MIT’s semi-annual payment cadence and ~6.4% yield make it a reasonable income stream, but the mild DPU erosion trend warrants monitoring over the next two reporting cycles.
MIT vs CapitaLand Ascendas REIT: Which Industrial REIT Wins?
The two largest Singapore-listed industrial S-REITs — MIT (ME8U) and CapitaLand Ascendas REIT (A17U) — are frequently compared by investors. Here is a head-to-head snapshot as at September 2026:
| Metric | MIT (ME8U) | CLAR (A17U) |
|---|---|---|
| Full-Year DPU | 12.71c | ~15.0c (est.) |
| Distribution Yield | ~6.4% | ~5.9% |
| P/NAV | ~1.14x | ~1.02x |
| Gearing | ~38.3% | ~37.2% |
| No. of Properties | 141 | ~230+ |
| Geographic Diversity | SG + North America | SG + AU + UK + US |
| Data Centre Exposure | ~57% of assets | ~10% of assets |
| DPU Trend (3yr) | Declining | Broadly stable |
Summary: MIT wins on current yield (~6.4% vs ~5.9%) and data centre growth optionality. CLAR wins on portfolio diversification, more stable DPU trend, and a closer-to-NAV entry price. Conservative income investors who prioritise DPU stability may prefer CLAR; investors with higher risk tolerance who want data centre exposure within a Singapore REIT wrapper may find MIT’s setup more compelling.
Both can be tracked and purchased via FSMOne (referral code P0544985), which offers a Regular Savings Plan for SGX-listed REITs with low minimum investment requirements.
For broader context on how to size S-REIT positions within your overall retirement plan, the Singapore retirement planning calculator on TKN can help you model income targets against target portfolio sizes.
Should You Buy Mapletree Industrial Trust in 2026?
MIT is a well-managed, diversified industrial REIT with a strong data centre tilt. Its 6.4% distribution yield is attractive relative to fixed-income alternatives, and the REIT’s sponsor (Mapletree Investments / Temasek) provides a credible pipeline for future asset injections.
MIT may suit you if:
- You want exposure to data centre growth via a SGX-listed S-REIT structure (tax-efficient for Singapore residents).
- You are comfortable holding a REIT trading at a modest premium to NAV (1.14x).
- You can accept a semi-annual distribution cadence and a mild DPU erosion trend over the near term.
- You want a Singapore REIT ETF alternative with direct single-REIT exposure to industrial and data centre assets.
MIT may not suit you if:
- You prioritise DPU growth — MIT’s distribution has declined from its FY2022/23 peak of 13.77c.
- You want to buy at a discount to NAV — MIT’s 1.14x P/NAV premium reduces the margin of safety.
- You are averse to currency risk — more than half of MIT’s assets generate USD/EUR income.
Not financial advice. Always assess your own risk tolerance, investment horizon, and diversification before purchasing any S-REIT. For personalised guidance, consult a licensed financial adviser.
Frequently Asked Questions About MIT (ME8U)
What is the current DPU of Mapletree Industrial Trust?
What is Mapletree Industrial Trust's distribution yield?
Is Mapletree Industrial Trust a good investment in 2026?
What is MIT's gearing ratio?
How do I buy Mapletree Industrial Trust in Singapore?
When does MIT pay its dividends?
What percentage of MIT's assets are data centres?
How does MIT compare to Keppel DC REIT?
What is MIT's NAV per unit?
This article was researched with the help of AI. While we strive to keep all information accurate and up to date, there may be errors. If you notice any discrepancies, please contact us.